

The USDJPY currency pair is displaying signs of further weakening as prices approach the lower boundary of the Bollinger Bands. This pattern suggests increasing selling pressure, particularly when the price breaches a significant support level in this area.
Other technical indicators, such as the MACD (Moving Average Convergence Divergence), also reinforce the bearish signal with the MACD line positioned below the signal line, indicating the dominance of sellers. The combination of these two indicators points to a strong potential for the downtrend in USDJPY to continue toward the next support level, prompting traders to be cautious of the possibility of deeper declines.
Recommended

Recommended

Recommended

Recommended
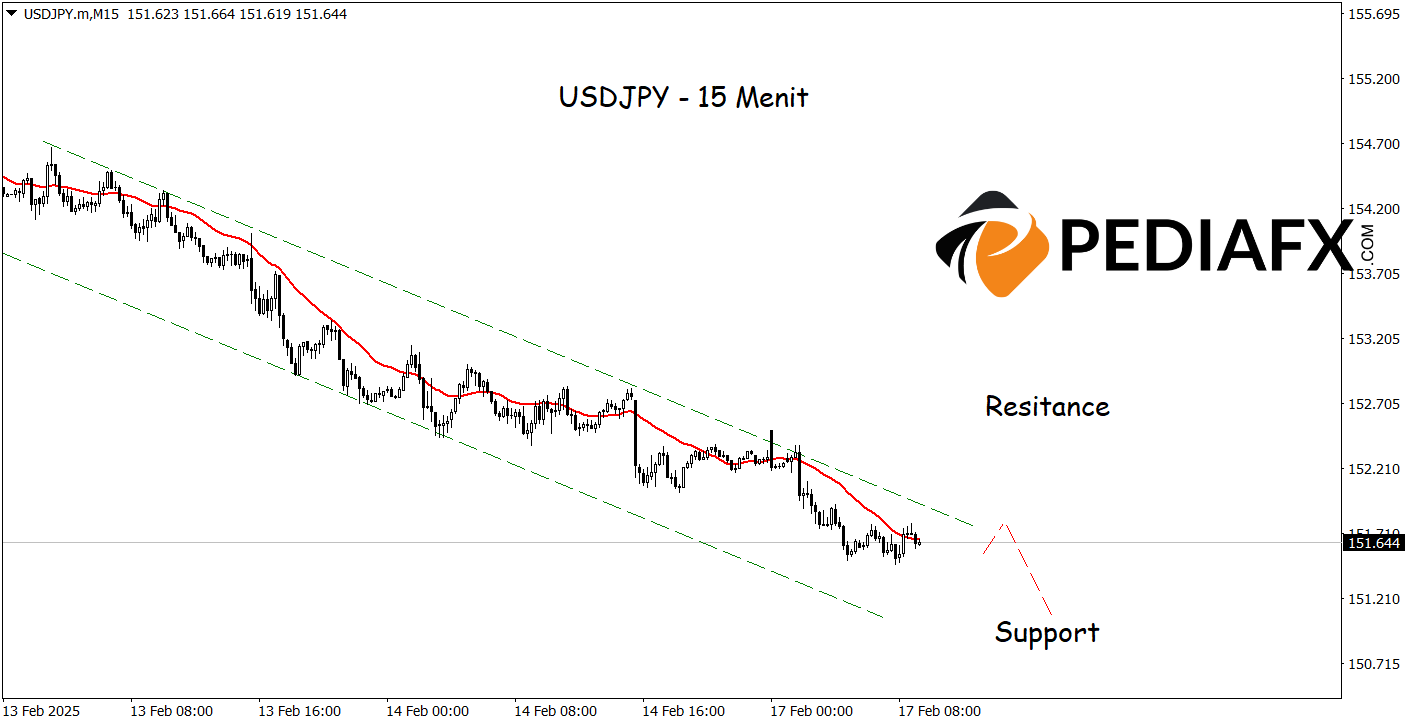
USDJPY remains under pressure as prices consistently move within a bearish channel, indicating a strong downward trend. The Moving Average (MA) indicator further confirms this signal, with prices staying below the MA line, reflecting the prevailing selling pressure. This technical formation indicates that sellers are still in control, creating an opportunity for USDJPY to continue its decline towards the 151.120 support level.
Technical Analysis: sell when below 152.555
Potential Stop Loss 1: 152.295
Potential Stop Loss 2: 152.555
Potential Take Profit 1: 151.390
Potential Take Profit 2: 151.120


