

The USDJPY currency pair is currently hovering near the upper range of the Bollinger Bands, signaling that prices are entering an overbought condition. When prices approach or touch the upper boundary of the Bollinger Bands, the likelihood of a downward correction typically increases as buying pressure starts to fade. This situation provides a preliminary indication that USDJPY might experience a drop in the near future.
In addition, the Stochastic indicator also reflects an overbought condition, reinforcing the expectation that bullish momentum has peaked. Under these circumstances, the chances of witnessing a downward movement in USDJPY grow stronger, with potential corrections toward the nearest support level.
Recommended

Recommended

Recommended

Recommended
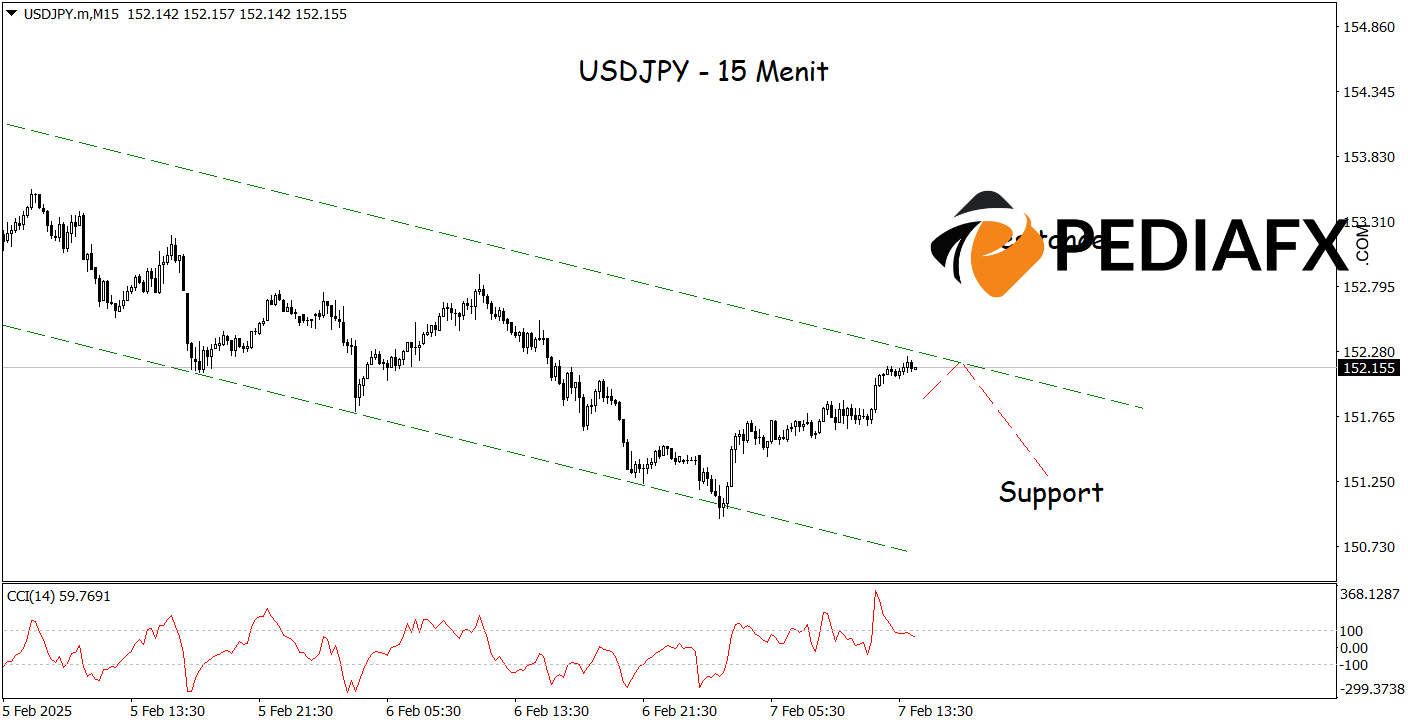
Technical analysis on the 15-minute timeframe indicates that USDJPY is forming a bearish channel pattern, signaling a prevailing downtrend in the short term. The continuous formation of lower lows and lower highs confirms that bearish pressure remains substantial. Furthermore, the Commodity Channel Index (CCI) entering the oversold zone suggests that selling momentum continues to dominate, with a potential for further weakening that could test the support level at 151.265.
Technical Reference: sell while below 153.010
Potential Stop Loss 1: 152.660
Potential Stop Loss 2: 153.010
Potential Take Profit 1: 151.585
Potential Take Profit 2: 151.265


