

The GBPUSD currency pair is once again exhibiting signs of decline after bouncing back from a significant resistance zone on the 1-hour timeframe. The failure to establish a higher high (HH) has led to a loss of bullish momentum, pushing the price down as it retests the lower bullish channel. This shift indicates a change in market sentiment, where buyers are gradually losing their grip while sellers are stepping in with more influence. The retest of the channel’s lower boundary further emphasizes the emerging bearish pressure in the short term.
Technical signals also align with this bearish scenario. The formation of a minor bearish Zigzag pattern suggests a reversal in price structure, while the MACD indicator remains in negative territory, reinforcing selling momentum. The synergy between these elements confirms that the selling activity may persist, especially if the price remains below the newly established resistance level. Continuous pressure from the indicators and price structure suggests that GBPUSD could continue its downward trajectory toward the nearest support level in the upcoming sessions.
Recommended

Recommended

Recommended

Recommended
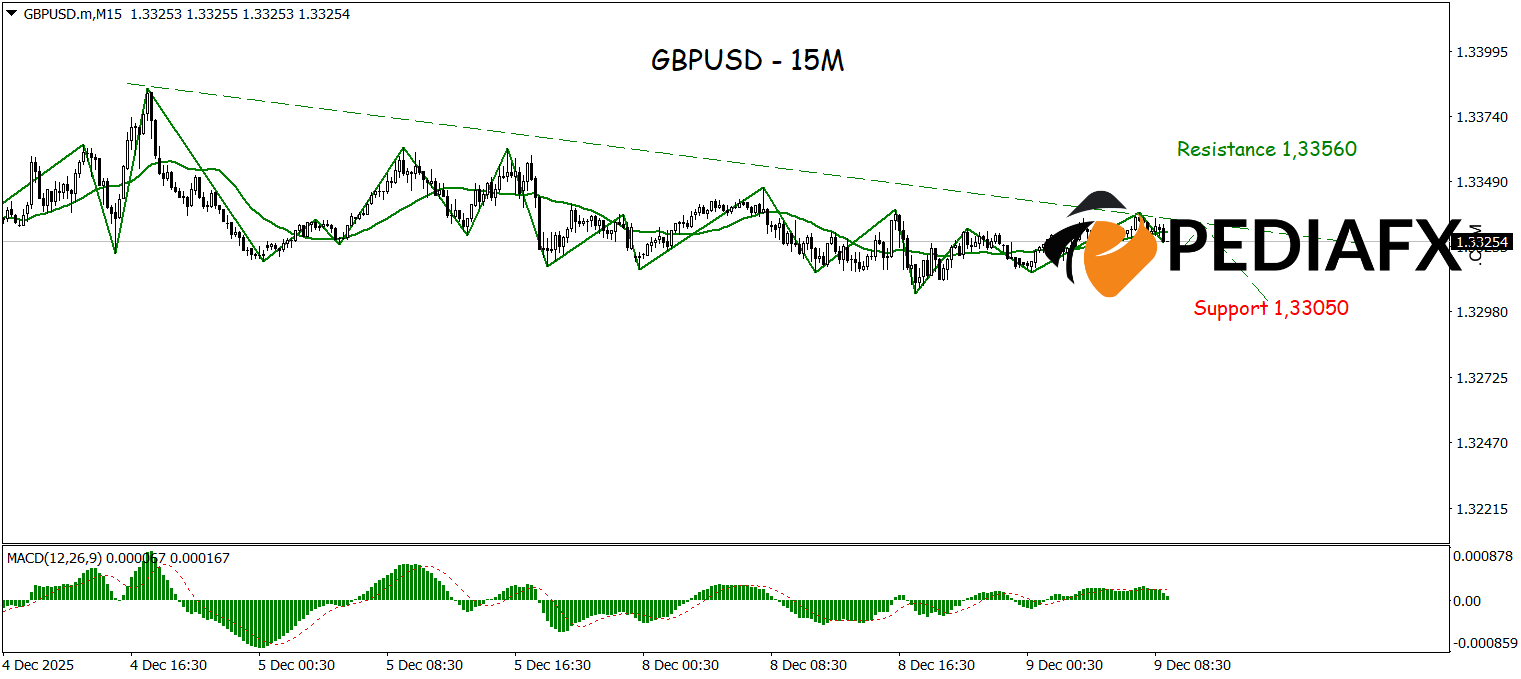
On the 15-minute timeframe, GBPUSD continues to show bearish pressure as the price consistently stays below the descending trendline, indicating that sellers maintain strong dominance in the short term. The downward Zigzag pattern reinforces this bearish structure, reflecting a clearer formation of lower highs and lower lows. With a solid technical combination leaning towards further weakness, GBPUSD has a high likelihood of continuing to drop and testing a critical support level around 1.33050.
Technical Reference: sell while below 1.33560
Potential Stop Loss 1: 1.33485
Potential Stop Loss 2: 1.32560
Potential Take Profit 1: 1.33140
Potential Take Profit 2: 1.33050


