

The USDJPY pair is currently facing significant bearish pressure following a brief rebound from the lower boundary of the Bollinger Bands towards the middle area. This price action reflects a technical pattern often indicative of a continued downtrend, particularly when accompanied by supporting signals from other indicators. One such indicator is the Stochastic Oscillator, which is currently showing oversold conditions, suggesting further potential weakness if selling momentum takes over again.
Recommended

Recommended

Recommended

Recommended
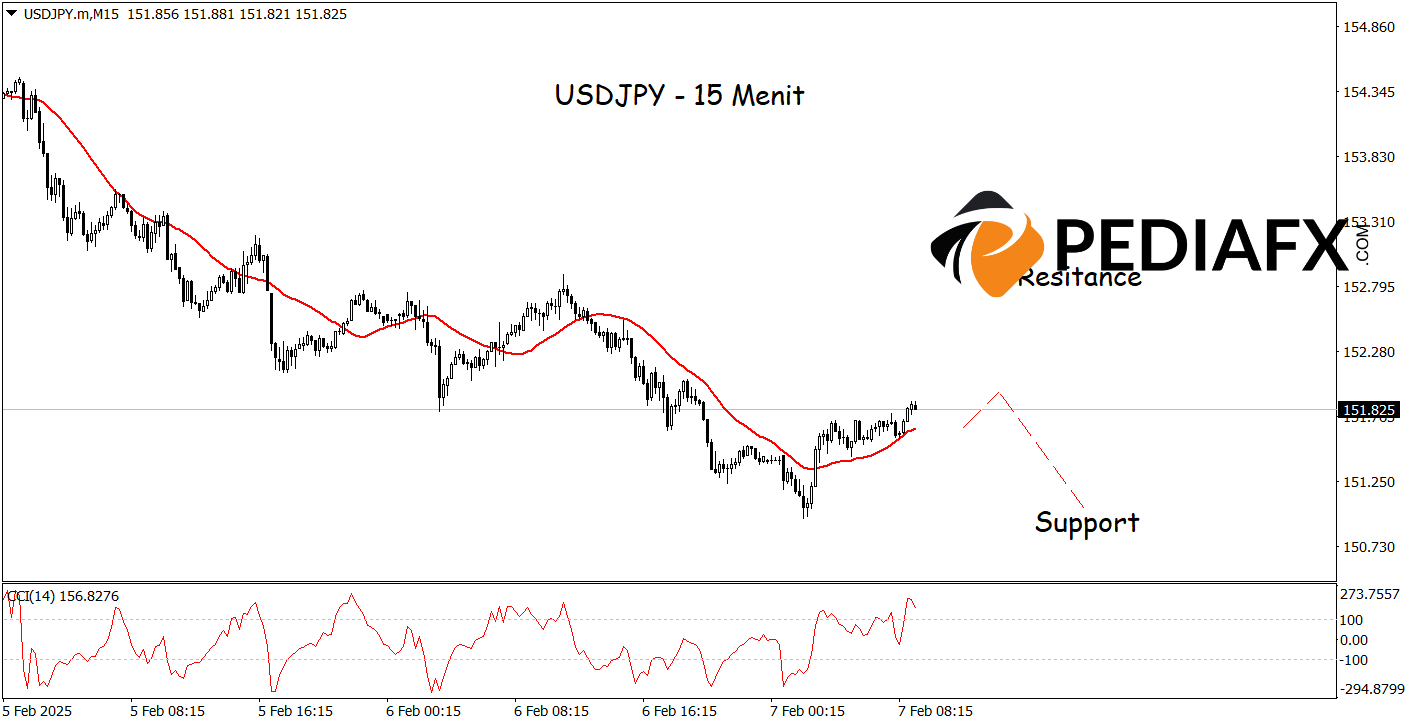
In the technical analysis of USDJPY, the Moving Average (MA) lines, which indicate a bearish trend, provide a basis for the prices to continue their downward movement on the 15-minute timeframe. Moreover, the Commodity Channel Index (CCI) is showing overbought conditions, suggesting that prices have risen too high and are likely due for a correction. The combination of these two indicators points to a potential further decline in USDJPY towards the support level of 151.025.
Technical Reference: sell while below 152.735
Potential Stop Loss 1: 152.355
Potential Stop Loss 2: 152.735
Potential Take Profit 1: 151.335
Potential Take Profit 2: 151.025


