


The Nasdaq index is currently facing renewed weakness after failing to sustain its upward momentum, as technical indicators reveal increasingly evident signs of a downturn. The Bollinger Bands are beginning to trend downward, signaling a rise in selling pressure and a decrease in upward volatility. The price movement consistently hovering near or below the middle line of the Bollinger Bands further suggests a short-term dominance of sellers. Meanwhile, the MACD indicator reinforces a bearish sentiment with a negative crossover below the zero line, confirming that a downward trend is forming and may continue further.
Given this technical confirmation, there is a significant risk that the Nasdaq may extend its decline toward the next crucial support level, especially if there are no fundamental drivers to rejuvenate market sentiment. The overall technical outlook indicates that the bearish trend remains prevalent, and a sell on rally strategy could be a preferred option until reversal signals emerge.

Recommended

Recommended

Recommended

Recommended
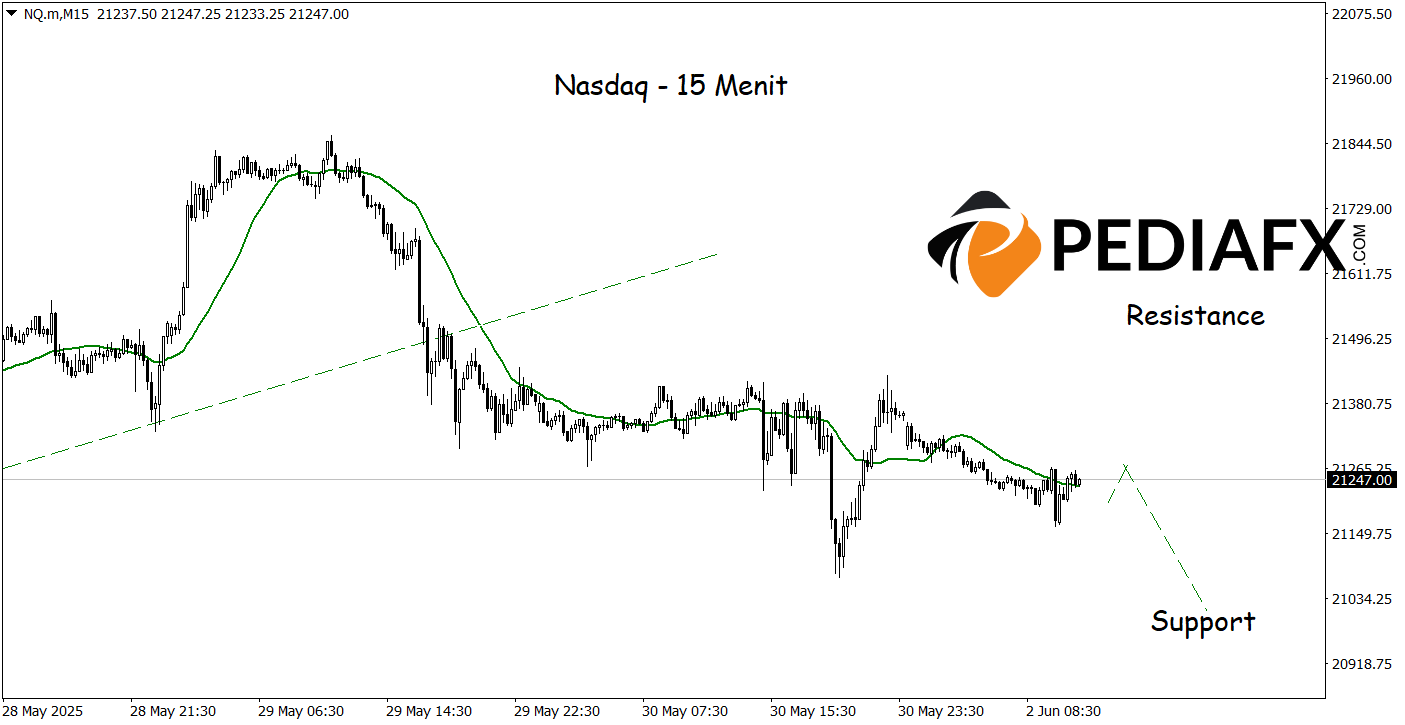
A bearish structure is beginning to form on the Nasdaq’s 15-minute timeframe, characterized by increasingly clear lower highs and lower lows, along with a declining tendency of the Moving Average (MA) line. This technical signal indicates that selling pressure is starting to dominate price movements in the short term, enhancing the likelihood of further declines. As long as the Nasdaq remains below the MA and fails to break through nearby resistance, there is potential for weakness toward the 21,008 support area.
Technical Reference: sell while below 21,505
Potential Stop Loss 1: 21,425
Potential Stop Loss 2: 21,505
Potential Take Profit 1: 21,105
Potential Take Profit 2: 21,010








