


The USDJPY currency pair has begun to exhibit signs of weakness after failing to maintain its upward momentum on the hourly chart. A bearish divergence is clearly visible, where the price has created higher peaks while the MACD indicator indicates a downward trend. This condition suggests that the strength of buyers is diminishing, with a notable decline in buying volume. Furthermore, the formation of a triple top within the shaded blue area reinforces the technical signal that selling pressure is beginning to escalate at the current price range.
The combination of the bearish divergence signal and the triple top pattern strongly indicates that USDJPY may enter a downward correction phase in the short term. Should selling pressure continue to build and the price breaches the nearest support level, the likelihood of a deeper decline increases significantly. However, as long as the price remains above this area, the potential for volatile movements may still occur before a complete downward direction is confirmed during the afternoon session.

Recommended

Recommended

Recommended

Recommended
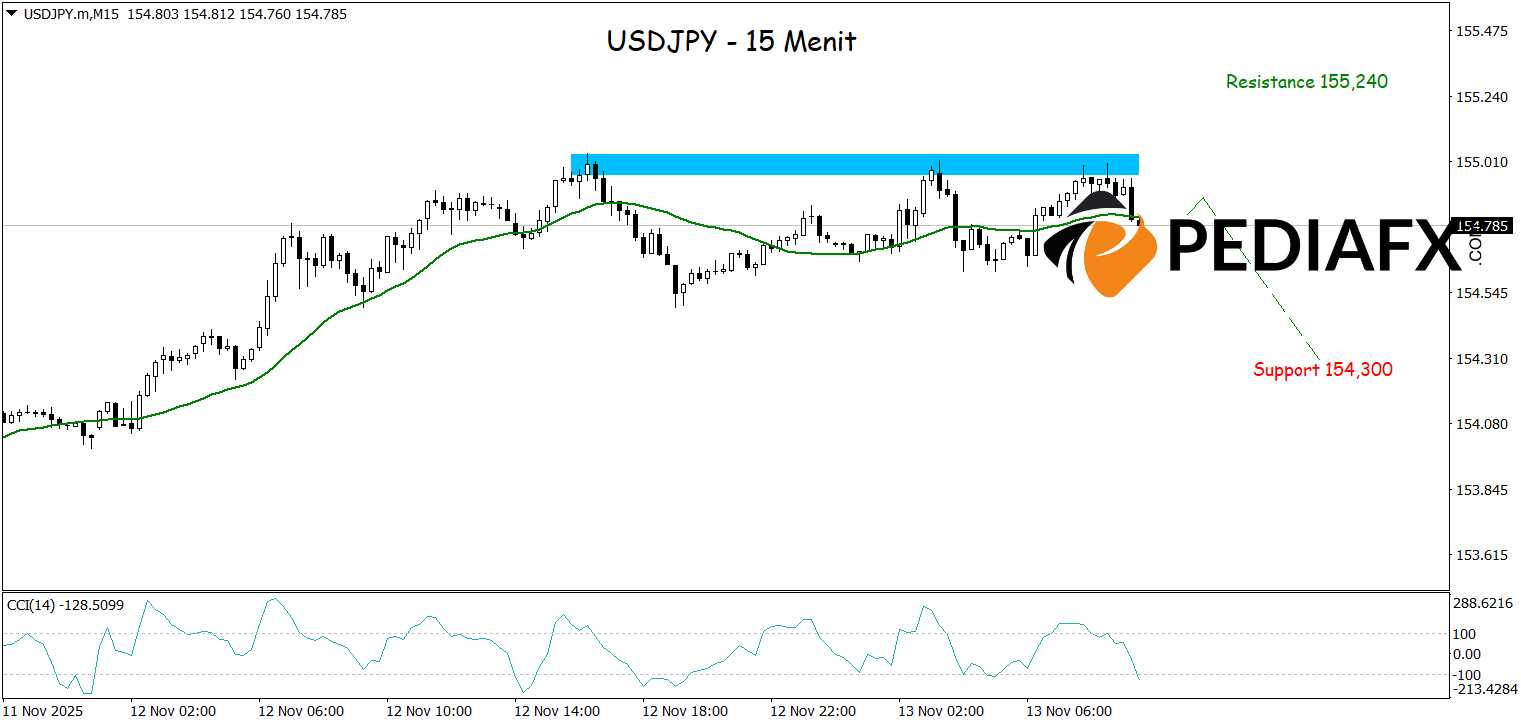
On the 15-minute chart, USDJPY appears to have been rejected from the resistance area, marked with blue shading, occurring three times, indicating that selling pressure is gaining strength. The Moving Average (MA) line has started to turn downwards, strengthening the signal for a bearish momentum shift. In addition, the CCI indicator’s descent from the overbought territory highlights the weakening strength of buyers. This combination of technical signals opens opportunities for USDJPY to continue its decline and test significant support levels around 154,300.
Technical Reference: Sell while below 155,240
Potential Take Profit 1: 155,070
Potential Take Profit 2: 155,240
Potential Stop Loss 1: 154,460
Potential Stop Loss 2: 154,300








