

While the primary trend of the Nasdaq on the 1-hour chart remains predominantly bullish, signs of a correction are beginning to emerge with the formation of a minor bearish channel evident in the red diagonal line on the price chart. Following a substantial rally, the index shows a deceleration in momentum, suggesting that some market participants are starting to take profits. The current price movement within this descending channel indicates short-term selling pressure, serving as an early signal of potential correction amidst an overall positive trend.
From a technical perspective, the Moving Average (MA) indicators have begun to flatten, while the lower high pattern on the ZigZag strengthens the short-term correction signal. Additionally, the Commodity Channel Index (CCI) has entered the overbought territory, increasing the likelihood of corrective pressure. The combination of these signals suggests that the Nasdaq index may experience a temporary pullback before buyers regain control to continue its main upward trend.
Recommended

Recommended

Recommended

Recommended
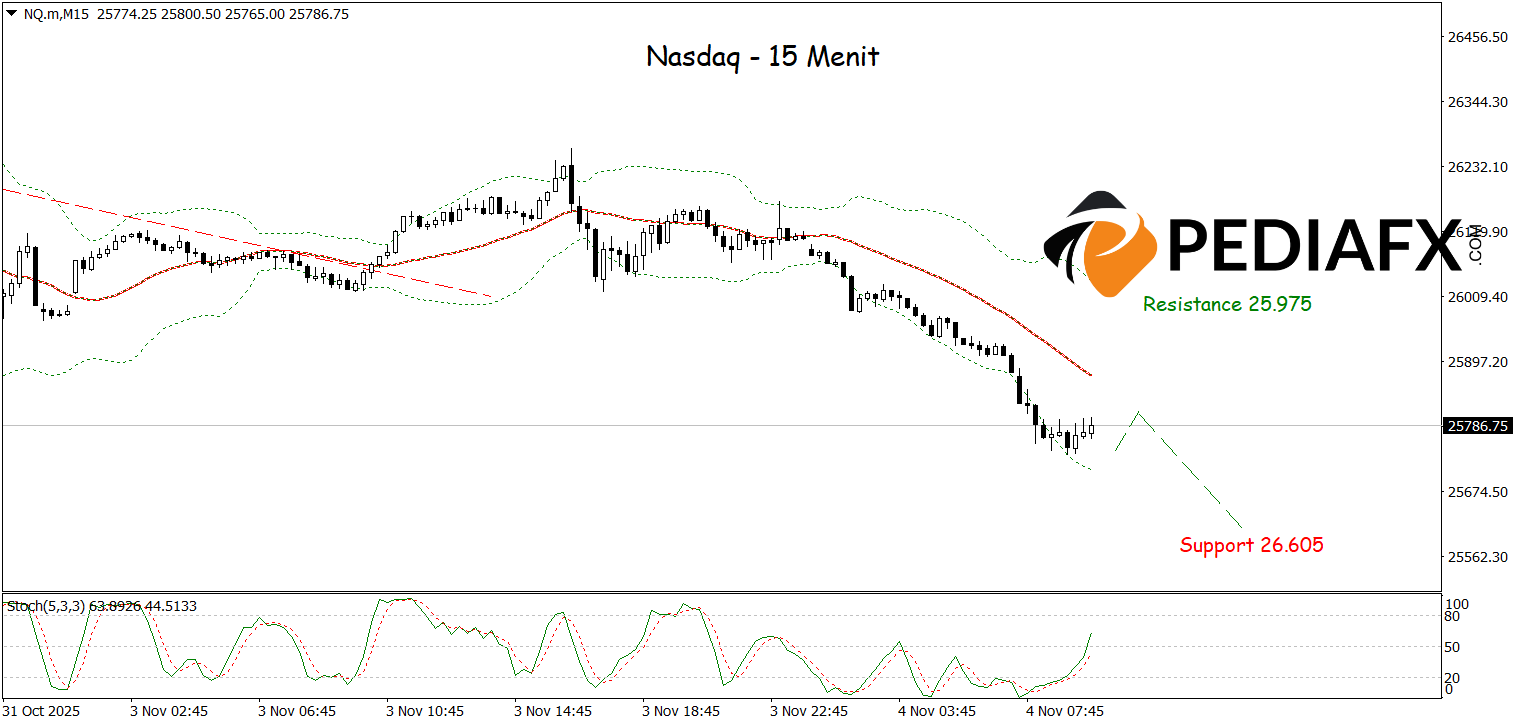
The bearish pressure is increasingly evident as the price breaches the lower boundary of the Bollinger Bands (BB), indicating a strengthening selling pressure. The continuing downward direction of the MA, coupled with the formation of a bearish trendline, provides additional confirmation that the downward momentum is persisting. As long as prices remain below the minor resistance area and selling pressure persists, the Nasdaq is likely to continue weakening, testing the next support zone around 25,900 in the near future.
Technical Reference: sell while below 25,975
Potential Take Profit 1: 25,665
Potential Take Profit 2: 25,605
Potential Stop Loss 1: 25,900
Potential Stop Loss 2: 25,975


