

On the 1-hour chart, USDJPY displays signs of weakening after a failed attempt to breach a continuation resistance level, resulting in a false break. Rather than continuing its ascent, the price reversed and broke through the upward خط الاتجاه, indicating increased selling pressure in the market. This structural shift suggests a sentiment change from صاعد ل سبحة في المدى القصير.
This bearish pressure is confirmed technically, as the Moving Average begins to trend downward and the ZigZag pattern reverses, forming a downward structure. These conditions reflect a strengthening dominance of الباعة, thus creating opportunities for USDJPY to continue its decline towards the nearest يدعم as long as the selling pressure persists.
مُستَحسَن

مُستَحسَن

مُستَحسَن

مُستَحسَن
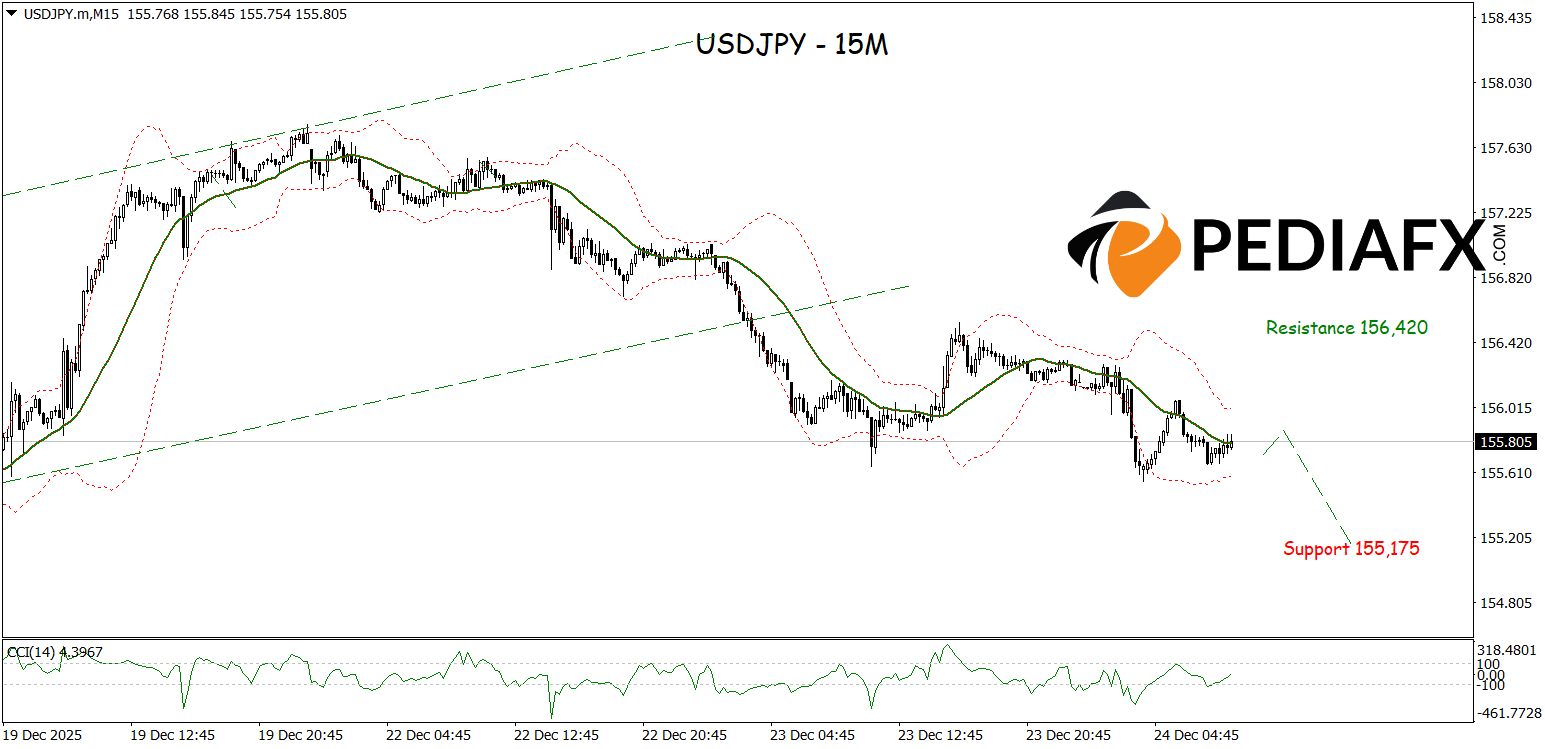
وفي الوقت نفسه، في الدقيقة 15 الإطار الزمني, USDJPY shows increasingly pronounced سبحة signals after the price broke below the lower limit of the قناة صاعدة. The expanding Bollinger Bands trending downward indicate an increase in downward momentum, supported by the CCI residing in the overbought region as a potential signal for a downward reversal. Given this combination of signals, USDJPY has the potential to extend its decline to test the يدعم level at 155.175.
المرجع الفني: يبيع if below 156.420
محتمل جني الأرباح 1: 156.185
محتمل جني الأرباح 2: 156.420
محتمل وقف الخسارة 1: 155.425
محتمل وقف الخسارة 2: 155.175


