

The hourly chart for EURUSD is beginning to exhibit signs of a trend reversal from bullish to bearish. The vỡ đáy trong vòng kênh giảm giá serves as the initial trigger for this directional shift, indicating that người mua are losing their grip on the market. The price structure forming Thấp hơn mức cao (LH) và Thấp hơn mức thấp (LL) further underscores the growing bearish pressure. This indicates that the momentum for người bán could potentially take over in the short term.
Additionally, the downward trajectory of the Bollinger Bands (BB) reinforces bearish signals. The widening of the bands to the downside suggests an increase in volatility skewed towards selling pressure, creating room for the EURUSD to continue its downward movement. If the bearish pressure persists, the prices could test the next ủng hộ area, solidifying the view that the downward trend is likely to continue in the near term.
Khuyến khích

Khuyến khích

Khuyến khích

Khuyến khích
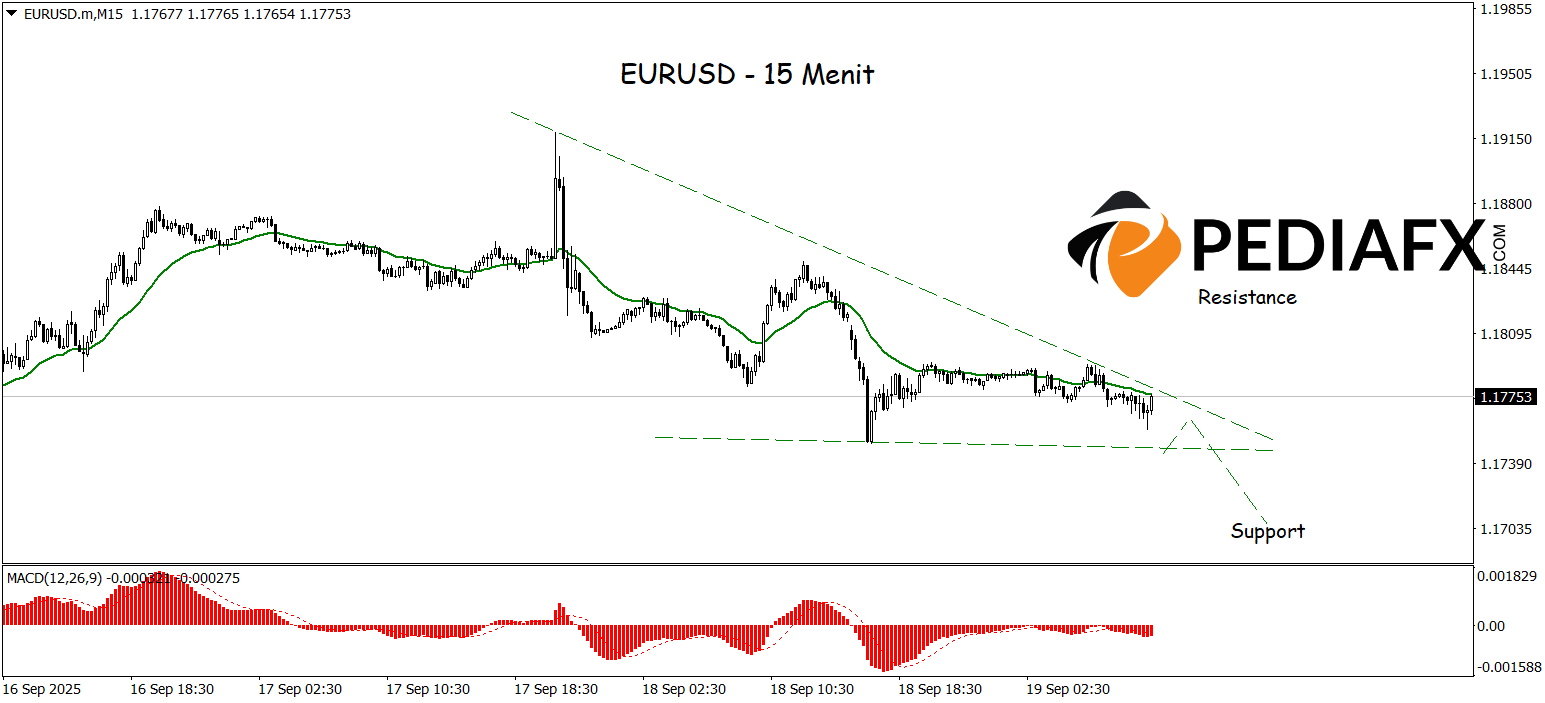
The ascending triangle pattern present on the 15-minute khung thời gian indicates the potential direction for EURUSD moving forward, yet selling pressure remains strong, as evidenced by the declining moving average (MA) and the MACD positioned in negative territory. This technical combination suggests further downward movement is possible for EURUSD, aiming to test the ủng hộ level around 1.17070.
Tài liệu tham khảo kỹ thuật: bán while below 1.18220
Tiềm năng Dừng lỗ 1: 1.18020
Tiềm năng Dừng lỗ 2: 1.18220
Tiềm năng Lấy lợi nhuận 1: 1.17170
Tiềm năng Lấy lợi nhuận 2: 1.17070


