

The Nasdaq chart on a 1-hour time frame indicates early signs of a trend reversal as prices have successfully พังข้างบน เดอะ ช่องต้านทานขาลง. This movement signifies the end of the prevailing selling pressure and unveils the possibility of a ระยะการฟื้นตัว. With prices able to hold above the breakout level, the market bias is shifting bullish, offering Nasdaq an opportunity for further upward movement.
The potential for strengthening is further validated by technical support indicators, where the Moving Average and ZigZag are beginning to trend upwards, reflecting the establishment of a healthier upward structure. Additionally, the MACD residing in positive territory indicates strengthening buying momentum. With this combination of signals, Nasdaq is poised to continue its ascent towards the nearest ความต้านทาน พื้นที่ในเร็วๆ นี้.
ที่แนะนำ

ที่แนะนำ

ที่แนะนำ

ที่แนะนำ
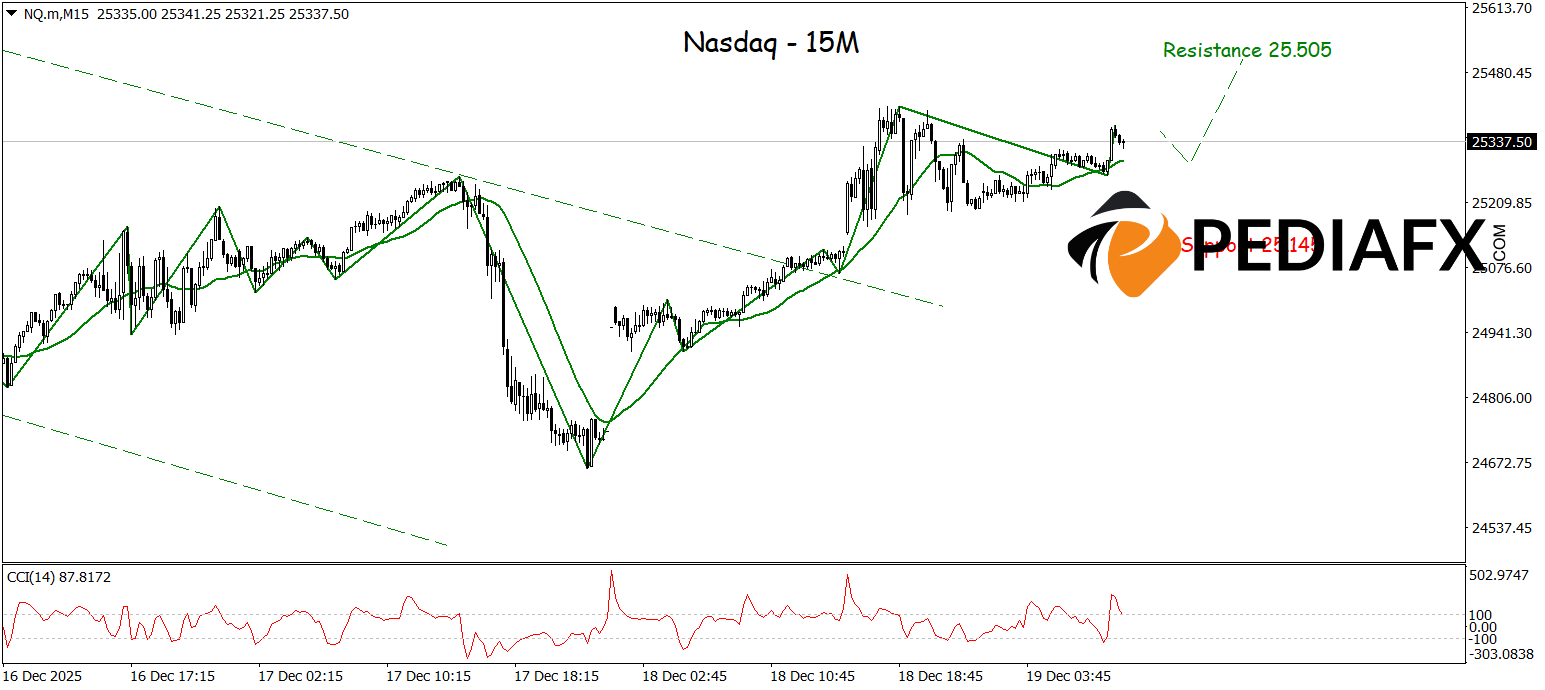
On the 15-minute chart, Nasdaq exhibits potential for growth after successfully breaching the ความต้านทาน level, which also marks the upper boundary of the bearish channel, signaling an initial trend direction change. An upward structure is beginning to take shape, supporting price movement and opening the door for Nasdaq to continue strengthening and test the nearest ความต้านทาน around 25,505 shortly.
ข้อมูลอ้างอิงทางเทคนิค: ซื้อ as long as above 25,145
ศักยภาพ รับผลกำไร 1: 25,447
ศักยภาพ รับผลกำไร 2: 25,505
ศักยภาพ สต็อปลอส 1: 25,220
ศักยภาพ สต็อปลอส 2: 25,145


