

The GBPUSD pair, as observed on the hourly chart, continues to display potential for upward movement, supported by a persistent uptrend structure. The steady price action, characterized by consistent higher highs and higher lows, reflects the sustained dominance of bidders, indicating that selling pressure is not yet strong enough to reverse the short-term trend. As long as this structure is maintained, the likelihood of a trend reversal remains low.
From a technical standpoint, the bullish sentiment is increasingly validated by the continued upward trajectory of the Moving Average and the ZigZag indicator, which maintains an uptrend structure. Further support comes from the CCI indicator, which is rising from oversold levels, signaling a resurgence of buying momentum. This combination of indicators suggests that GBPUSD has the potential to strengthen further and reach higher price levels in the near future.
Recommended

Recommended

Recommended

Recommended
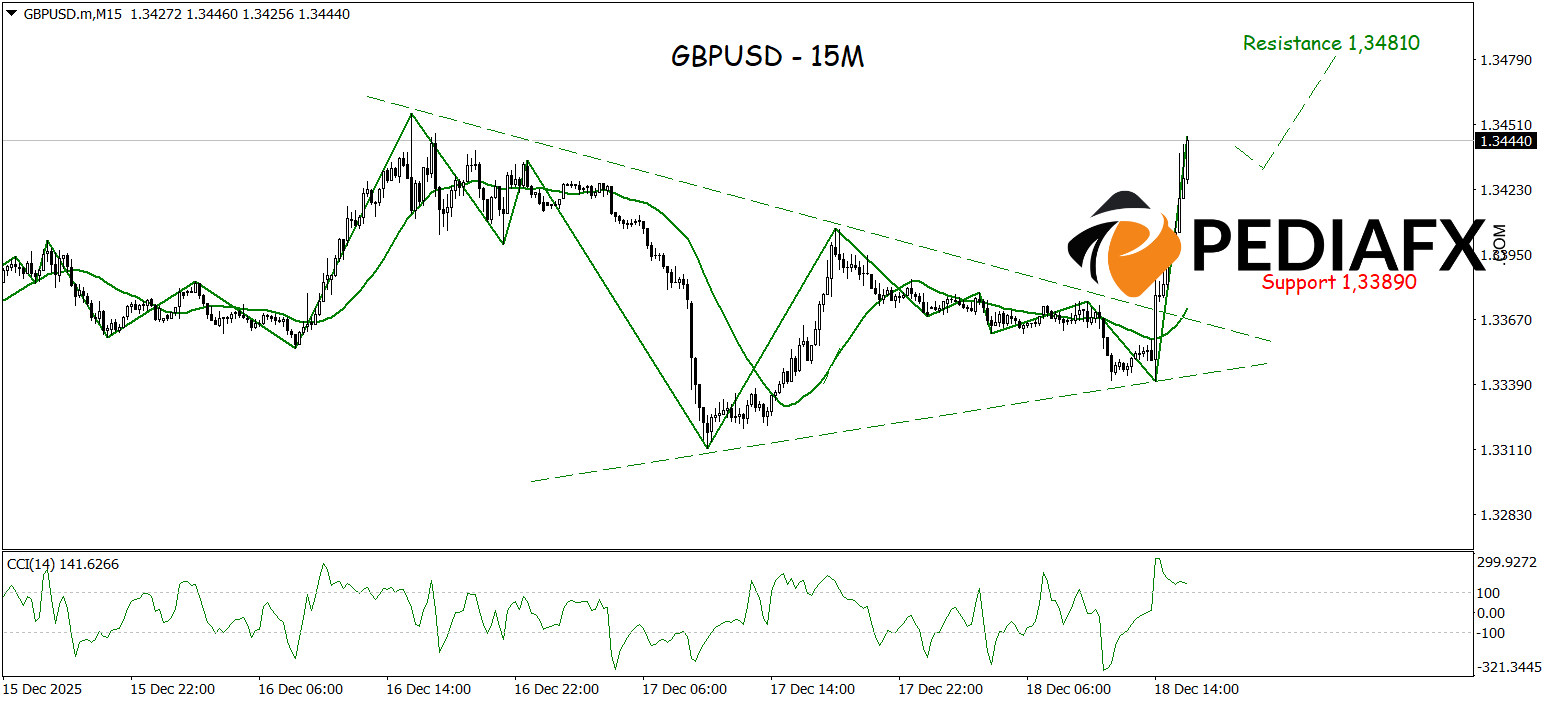
On the 15-minute chart, GBPUSD also displays signs of strengthening after successfully breaking above the upper boundary of a symmetrical triangle, indicating a potential continuation of the upward trend. Technical support is highlighted by the rising Moving Average and the ZigZag indicator, which is again forming an uptrend, confirming the momentum of buying activity. With this confirmation in place, GBPUSD is poised for further increases, possibly testing the resistance level at 1.34810 soon.
Technical Reference: Buy while above 1.33890
Potential Take Profit 1: 1.34685
Potential Take Profit 2: 1.34810
Potential Stop Loss 1: 1.34050
Potential Stop Loss 2: 1.33890


