

After experiencing significant selling pressure, Gold is beginning to reveal early signs of a trend reversal. The sharp decline previously created a series of Lower Highs (LH) and Lower Lows (LL) on the 1-hour chart, reinforcing the fact that sellers remain in control of market movements. Supporting signals from the Zigzag and Moving Average (MA), which are now flattening, further strengthen the viewpoint that a short-term corrective phase is currently underway. This shifting structure is a focal point, as it could serve as a foundation for establishing a more robust bearish trend if selling pressure persists.
In the short term, the price movement outlook remains negative with risks of further declines during today’s afternoon session. As long as prices cannot breach and sustain above the nearest resistance level, the potential for weakening still prevails. Market participants should pay close attention to price responses around dynamic support, as breaching this area could allow downward momentum to intensify again. However, if a rebound occurs, it is likely to be merely technical and insufficient to change the prevailing downward trend.
Recommended

Recommended

Recommended

Recommended
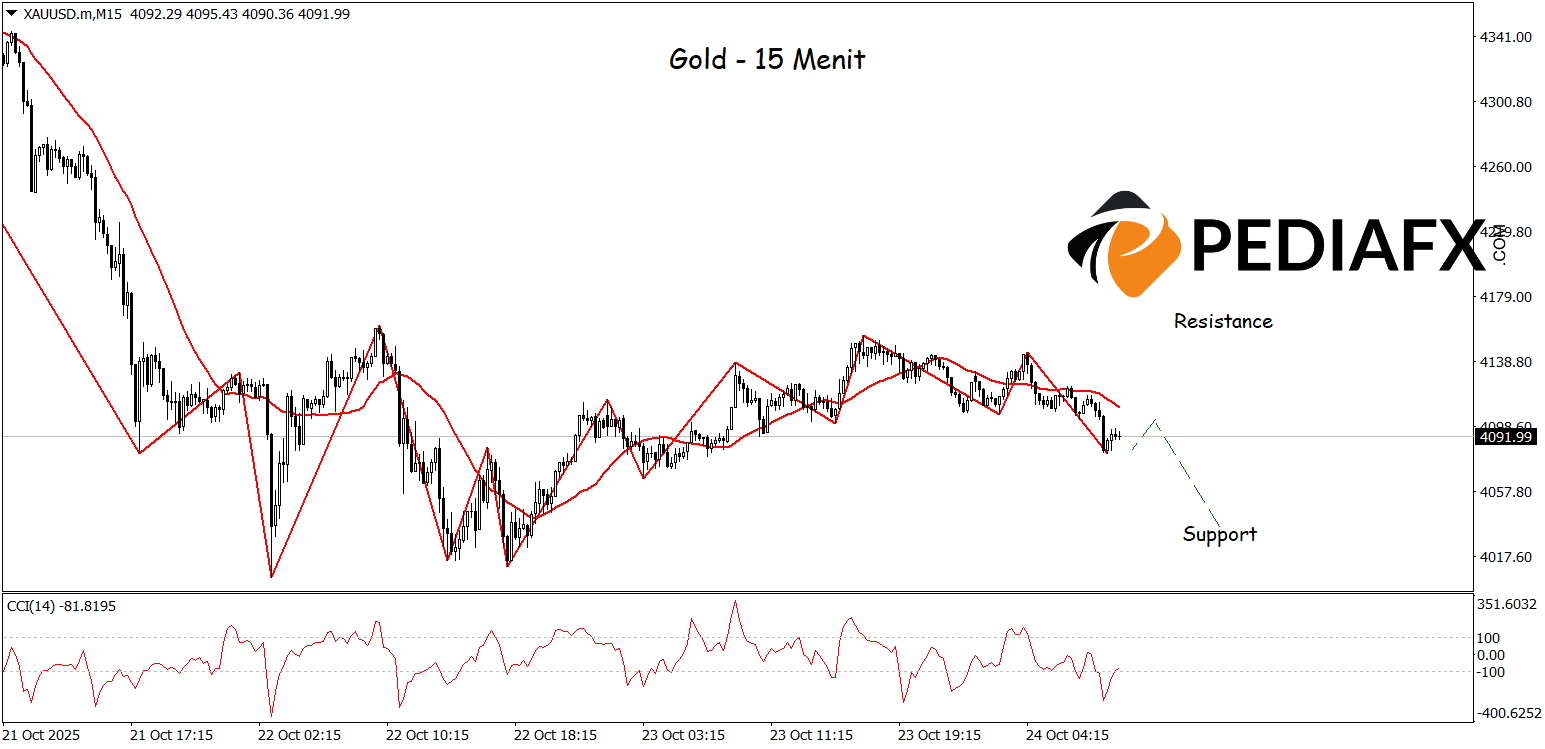
On the 15-minute time frame, the Zigzag and Moving Average (MA) indicators still indicate a bearish direction, suggesting that selling pressure is still dominant. At the same time, the Commodity Channel Index (CCI) operates in the oversold area, signaling that prices may continue to weaken before experiencing a technical correction. This combination of signals elevates the likelihood for Gold to test the key support area at $4,036, which has now become a critical lower boundary in the short-term movement structure and could dictate the next direction of the market trend.
Technical Reference: sell while below 4,155
Potential Stop Loss 1: 4,135
Potential Stop Loss 2: 4,155
Potential Take Profit 1: 4,057
Potential Take Profit 2: 4,036


