

Following a significant selling pressure, Gold is now displaying early signs of a trend direction change. The previous selling momentum has led to a notable decrease in price, and on the hourly chart, a pattern of Lower High (LH) and Lower Low (LL) is emerging, indicating that seller dominance remains substantial. This indication is reinforced by signals from the Zigzag and Moving Average (MA) indicators, which are currently trending downward, offering additional confirmation that a short-term corrective phase is underway. This transition is crucial as it suggests the potential for a more robust bearish structure if the selling pressure continues.
In the short term, the price outlook remains negative with further declines likely during this afternoon session. As long as the price fails to break and sustain levels above the nearest resistance area, the chances of continued weakening remain viable. Market participants are advised to monitor price reactions around the dynamic support zone, as a break below this area could accelerate the next downside momentum. Meanwhile, if a rebound occurs, the movement is likely to be technical and limited until the main trend is reaffirmed.
Recommended

Recommended

Recommended

Recommended
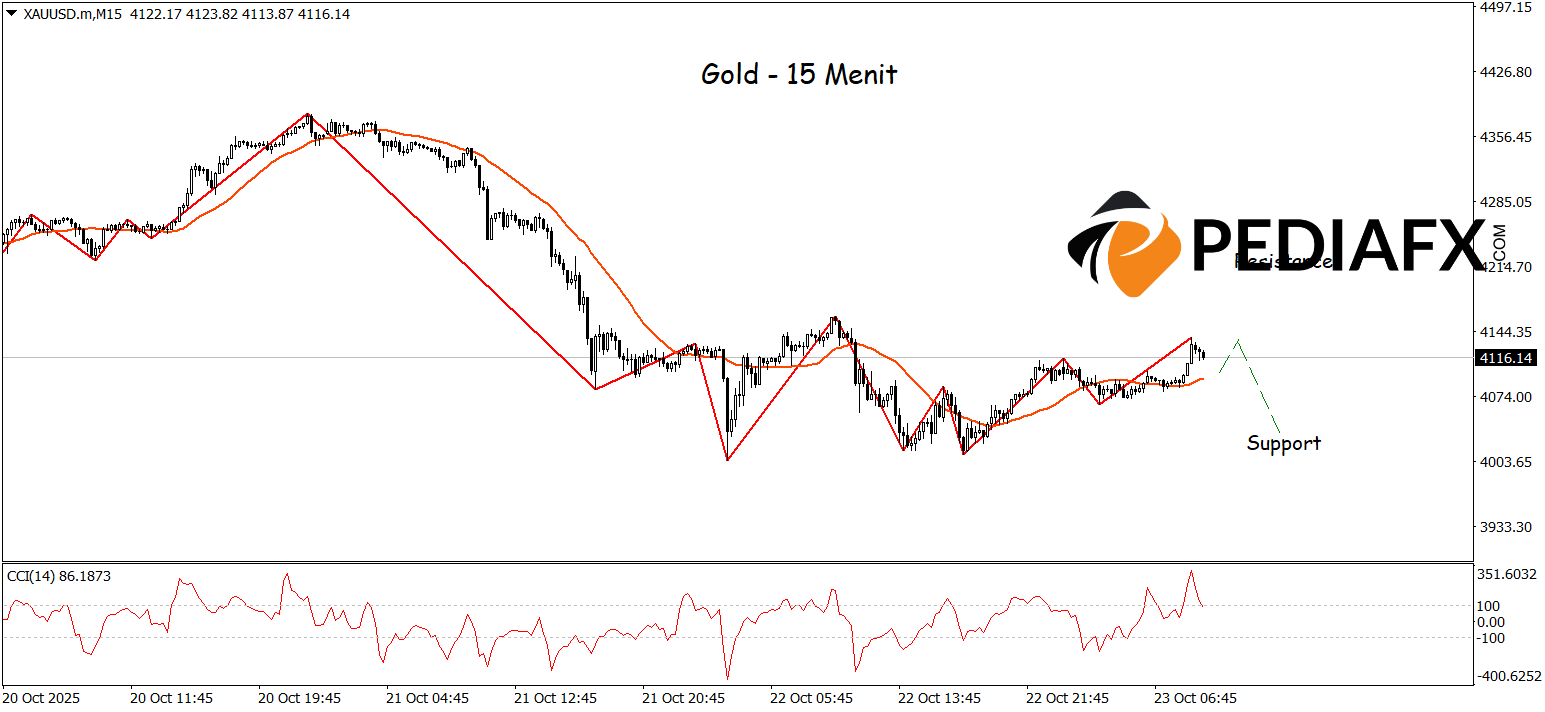
On the 15-minute time frame, the Zigzag and Moving Average (MA) indicators continue to confirm the downward direction, demonstrating that selling pressure dominates price movements. Additionally, the CCI positioned in the oversold territory signals the potential for continued weakening before a possible technical rebound occurs. This combination of signals adds the likelihood that Gold may test the crucial support level of $4,034, which serves as a critical lower boundary in the short-term movement structure.
Technical References: buy if above 4,210
Potential Take Profit 1: 4,175
Potential Take Profit 2: 4,210
Potential Stop Loss 1: 4,063
Potential Stop Loss 2: 4,034


