

On the 1-hour chart, the Nasdaq has once again exhibited bullish signals as the price successfully moved above the Moving Average (MA) line. The fact that the price remains above this moving average indicates that the upward trend is solidifying, with buyers regaining control. The increase observed is also reflective of a positive market sentiment, where investors are becoming more optimistic about the prospects of the technology index.
Additionally, the MACD indicator further strengthens the bullish direction with its histogram movement entering positive territory. This technical confirmation provides additional support for the Nasdaq to continue its rally towards the next resistance level. As long as the price stays above the nearest support, the chances of further increases remain wide open, maintaining the potential for a positive short-term trend for the Nasdaq.
Recommended

Recommended

Recommended

Recommended
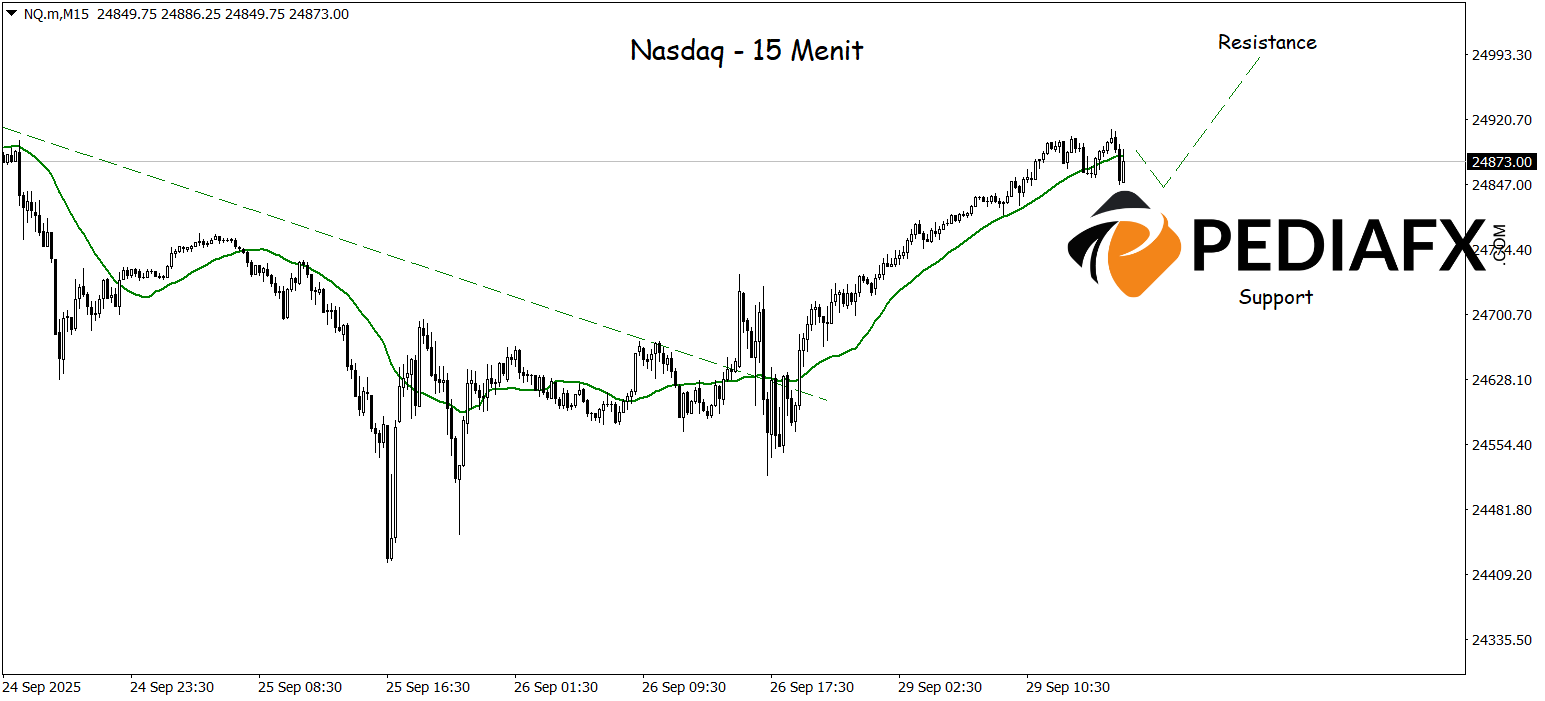
On the 15-minute chart, the Nasdaq has successfully broken through the bearish trendline, while the Moving Average (MA) is beginning to trend upward, signaling that a bullish momentum is starting to develop. This technical situation opens up opportunities for the Nasdaq to continue strengthening and test a significant resistance level around 24,875, as long as the price can maintain its position above the nearest support.
Technical Reference: buy while above 24,730
Potential Take Profit 1: 24,944
Potential Take Profit 2: 24,990
Potential Stop Loss 1: 24,765
Potential Stop Loss 2: 24,730


