

The Nasdaq remains within a bullish channel on the 1-hour chart, affirming that buyers continue to hold sway over market direction. This upward trend is clearly visible, supported by an upward-sloping Moving Average (MA) and a zigzag formation that indicates an uptrend, reinforcing the sentiment that the bullish trend is well maintained.
Moreover, the MACD indicator, which is hovering in positive territory, enhances the confidence that the Nasdaq still has ample potential for further gains. As long as prices stay within the bullish channel and do not breach the dynamic support level, the Nasdaq is likely to continue its upward trajectory, even challenging higher resistance levels in future movements.
Recommended

Recommended

Recommended

Recommended
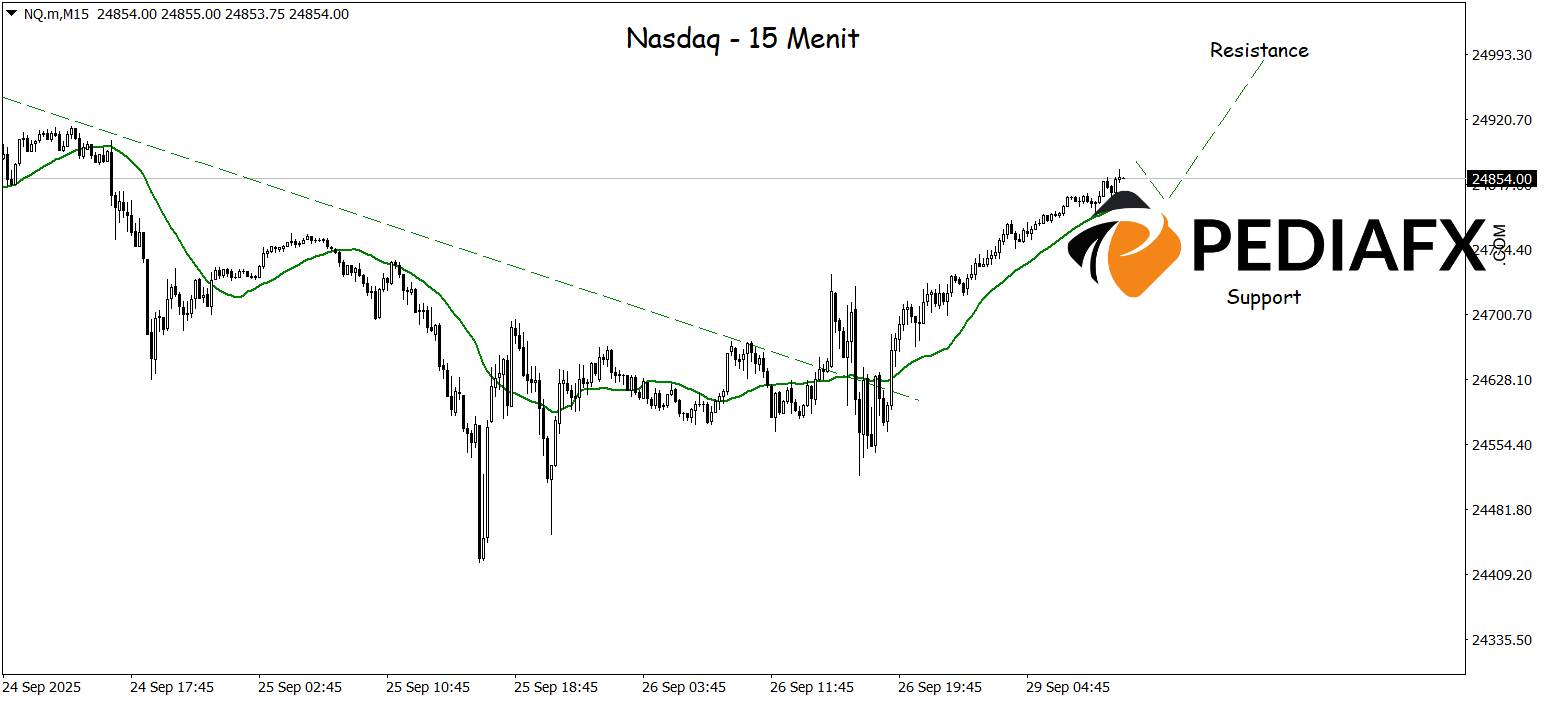
On the 15-minute chart, the Nasdaq has successfully broken above the bearish trendline, while the Moving Average (MA) is also trending upward, signaling that bullish momentum is starting to take shape. This technical condition opens up avenues for the Nasdaq to extend its gains and test significant resistance around 24,990, assuming it can maintain levels above the nearest support.
Technical Reference: buy while above 24,730
Potential Take Profit 1: 24,944
Potential Take Profit 2: 24,990
Potential Stop Loss 1: 24,765
Potential Stop Loss 2: 24,730


