

After reaching a resistance level within the bullish channel on the hourly chart, the Nasdaq was unable to sustain its upward trend by forming a new high. This situation signifies an early warning of deteriorating buying momentum and simultaneously creates space for increased selling pressure. The profit-taking activities emerging around the resistance zone are further applying downward pressure on prices, indicating that market participants are becoming cautious about the continuation of the ascending trend.
The prevailing selling pressure could lead to a short-term correction in the Nasdaq. Should this pressure persist, the index may potentially test the nearest support area as confirmation of a directional shift. Nevertheless, as long as the primary support level holds firm, this correction can be viewed as a healthy consolidation phase before the larger trend determines the next direction.
Recommended

Recommended

Recommended

Recommended
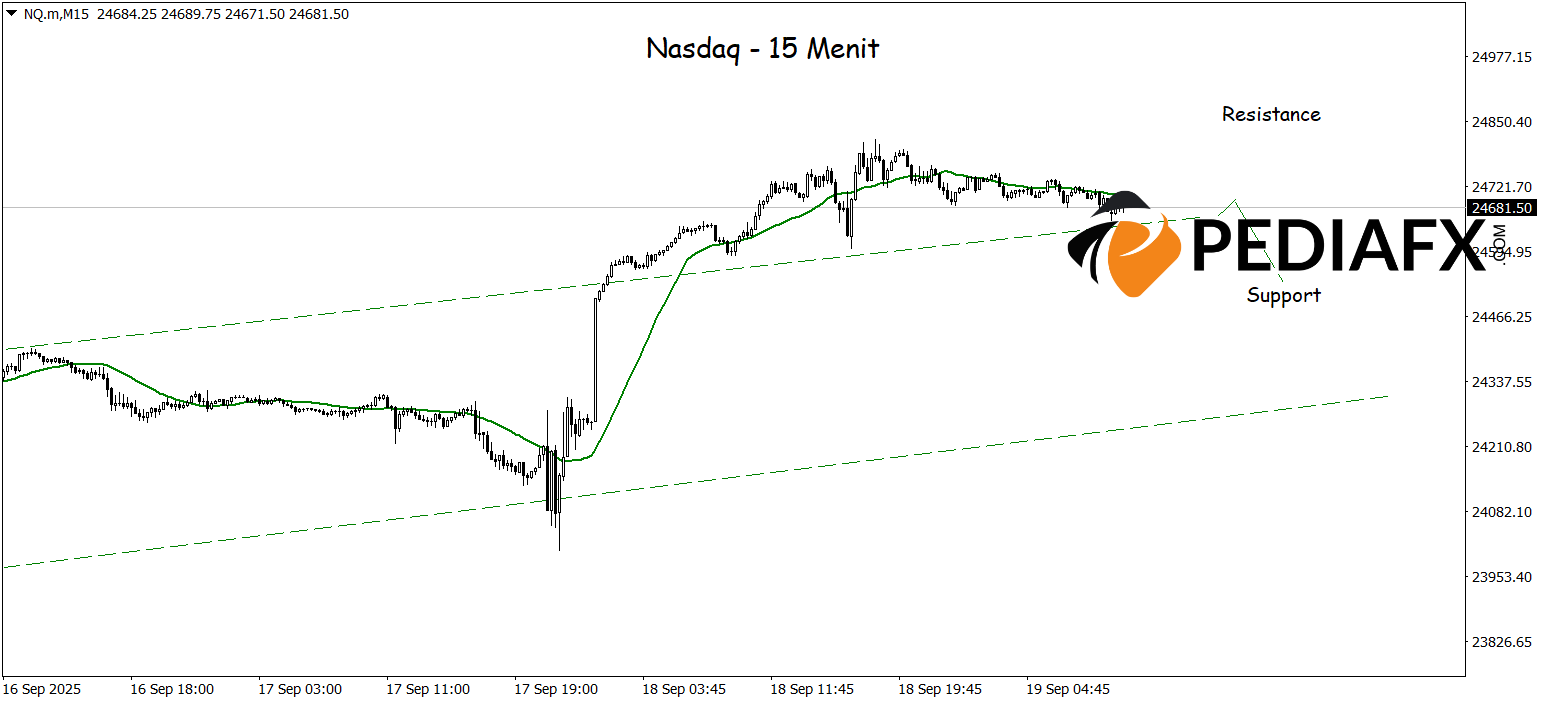
Meanwhile, on the 15-minute time frame, the Nasdaq also indicates a potential downward pressure after previously touching its all-time high. The current position of the Moving Average (MA), which is situated above the running price, reinforces the bearish signals, thus opening doors for the index to continue its decline with a target of testing the nearest support around 24,530.
Technical Reference: sell below 24,843
Potential Take Profit 1: 24,772
Potential Take Profit 2: 24,843
Potential Stop Loss 1: 24,611
Potential Stop Loss 2: 24,530


