

The Nasdaq has begun to exhibit weakness after prices broke below the bullish channel on the one-hour chart. This breach signals the initial stages of increasing selling pressure, characterized by a steep decline in the Moving Average (MA) and a reversal in the ZigZag pattern, underscoring the sellers’ dominance. This situation indicates that buyers are losing momentum, paving the way for a potential bearish market direction.
Further confirmation arises from the MACD indicator, which has now entered negative territory. This MACD positioning suggests that selling sentiment is gaining strength, allowing for the possibility of further corrections. As long as prices remain below the breaklow threshold, the outlook for declines will continue to be the prevailing scenario, especially in the short term.
Recommended

Recommended

Recommended

Recommended
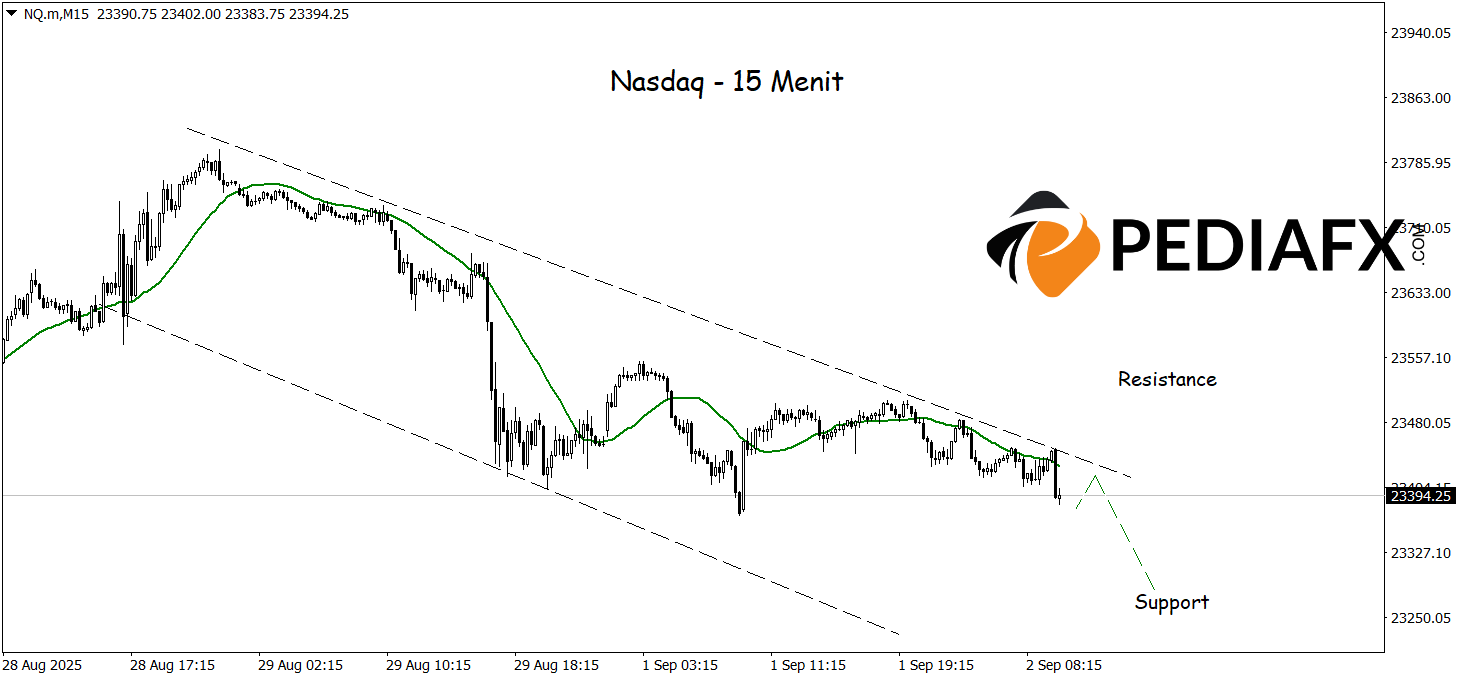
With the sustained bearish pressure, it is anticipated that the Nasdaq may test the next support level. The area around 23.285 is currently a crucial focus for market participants, where price reactions at this level could determine the subsequent market direction. Should the selling pressure persist, the potential for deeper declines remains open, while a rebound could only occur if buyers manage to hold above this key support level.
Technical Reference: sell while below 23.513
Potential Stop Loss 1: 23.472
Potential Stop Loss 2: 23.513
Potential Take Profit 1: 23.325
Potential Take Profit 2: 23.286


