

The Nasdaq hourly chart indicates a bullish signal as the price successfully breaks through the bearish trendline that has suppressed its movement. The formation of a Zigzag pattern further confirms a shift in direction, with swing lows rising in tandem with prices that are now positioned above the Moving Average (MA), serving as a dynamic support level. This situation suggests that buying pressure is starting to dominate, thereby enhancing the prospects of a short-term upward trend.
The positive momentum strengthens significantly following the trendline break, with further confirmation from the MA and Zigzag patterns reinforcing the directional consistency. As long as prices remain above the breakout area, the likelihood of the Nasdaq continuing to climb and test the nearest resistance level remains intact. However, should the price dip back below the MA, short-term correction risks must be acknowledged.
Recommended

Recommended

Recommended

Recommended
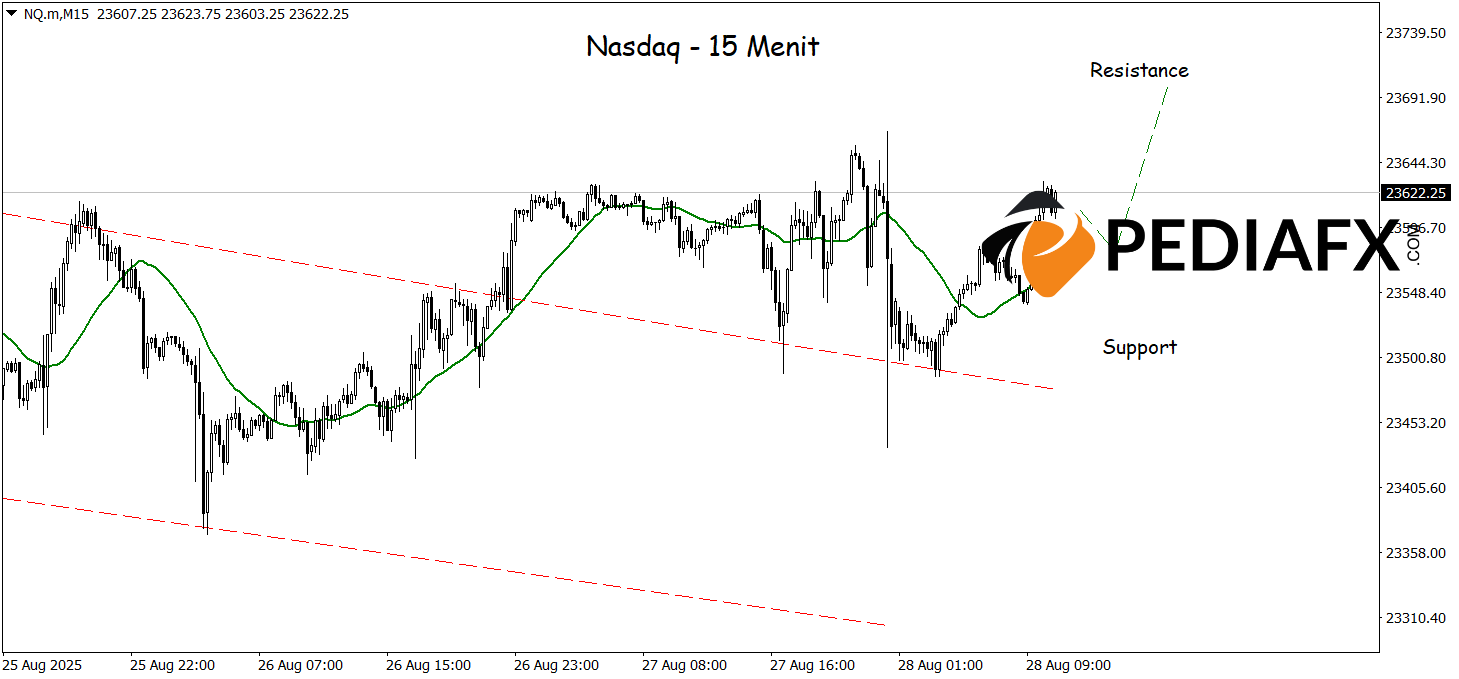
Meanwhile, the 15-minute chart also shows Nasdaq gaining strength after successfully breaking high from the bearish channel that has constrained the price movement. This change serves as an initial signal for potential short-term bullishness, strengthened by the MA now aligning with bullish momentum. With this technical support, the Nasdaq is poised to continue its rally towards resistance at 23,700, a key level for the sustainability of the forthcoming strengthening trend.
Technical Reference: buy as long as above 23,515
Potential Take Profit 1: 23,668
Potential Take Profit 2: 23,700
Potential Stop Loss 1: 23,550
Potential Stop Loss 2: 23,515


