

The Nasdaq has begun to exhibit signs of weakness following a break below its bullish channel on the one-hour chart. This movement serves as an early indication of a potential trend reversal, shifting from bullish to bearish. The descending trend of the Moving Average (MA) reinforces the signal that selling pressure is starting to take control of the market. Moreover, the ZigZag pattern reveals a clearer series of declines, confirming that buyers are losing momentum to sustain the upward trend.
Given these technical conditions, there is a significant chance for a corrective move in the Nasdaq. Should selling pressure continue, the index could further weaken towards the nearest support level, representing the next testing area. Conversely, if prices can hold above crucial support, a rebound might still occur as a retest effort before a true bearish trend is fully confirmed. This situation urges the market to keep a close eye on key levels that will determine the Nasdaq’s short-term movement.
Recommended

Recommended

Recommended

Recommended
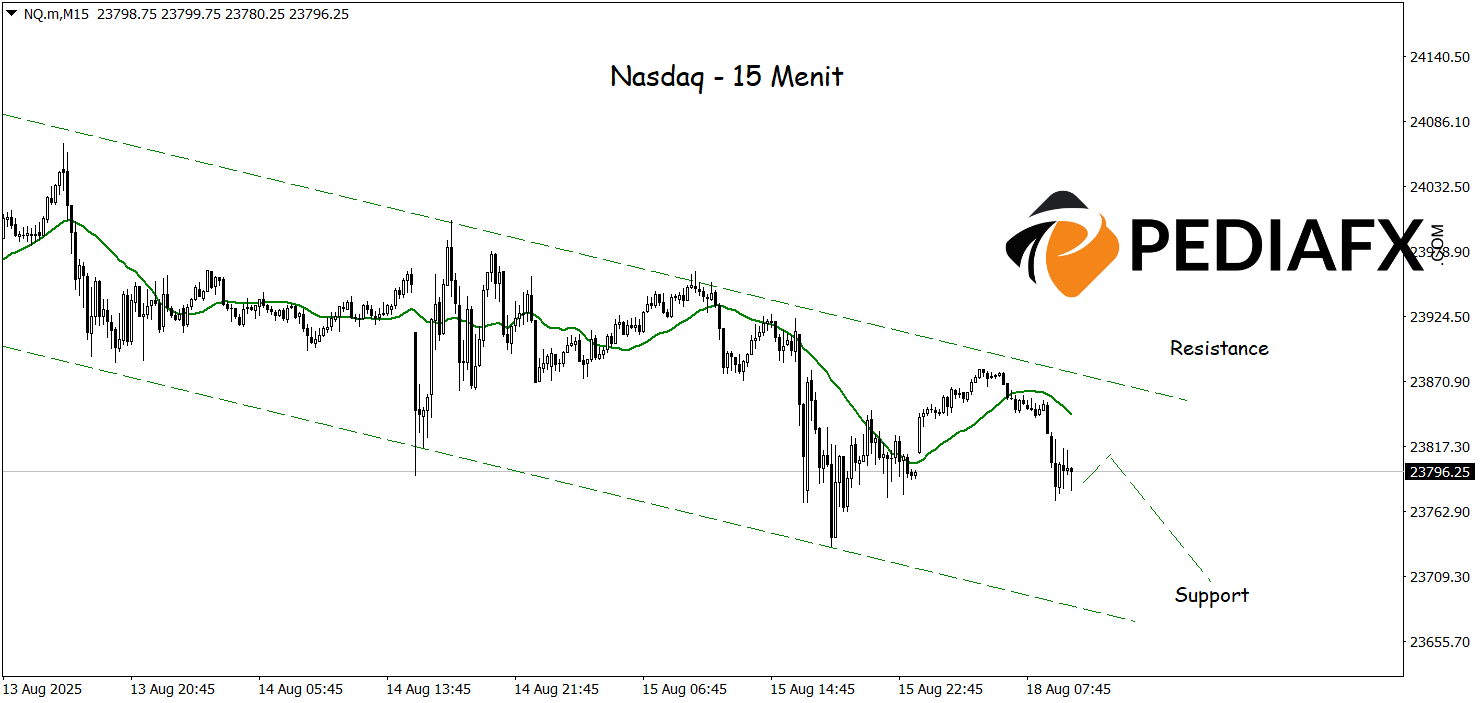
The Nasdaq has established a bearish channel on the fifteen-minute chart, confirming the predominance of selling in the market. This technical pressure opens up further downside potential, with the Nasdaq expected to test the nearby support level at 23,700 as the next target for decline.
Technical Reference: sell when below 23,885
Potential Stop Loss 1: 23,850
Potential Stop Loss 2: 23,885
Potential Take Profit 1: 23,740
Potential Take Profit 2: 23,700


