

The price has shown an upward trend on the 1-hour timeframe; however, signs of weakening are becoming apparent in tonight’s US session as indicated by a bearish divergence observed in the MACD indicator. Although the price has established a new high, the MACD histogram is on the decline, signaling that the bullish momentum is starting to wane. This scenario often serves as an early warning for the market that the rising trend may soon reverse, necessitating traders to remain vigilant for potential selling pressure in the near term.
The likelihood of a downturn is further reinforced by the downward trajectory of the Moving Average (MA), which offers additional confirmation that technical bias is shifting towards bearish. Should the selling pressure intensify, the price could enter a more substantial correction phase or even initiate a new downward trend. This situation presents strategic opportunities for traders aiming to capitalize on selling momentum once a reversal signal is confirmed, while preparing for a test of crucial support levels beneath the current price.
Recommended

Recommended

Recommended

Recommended
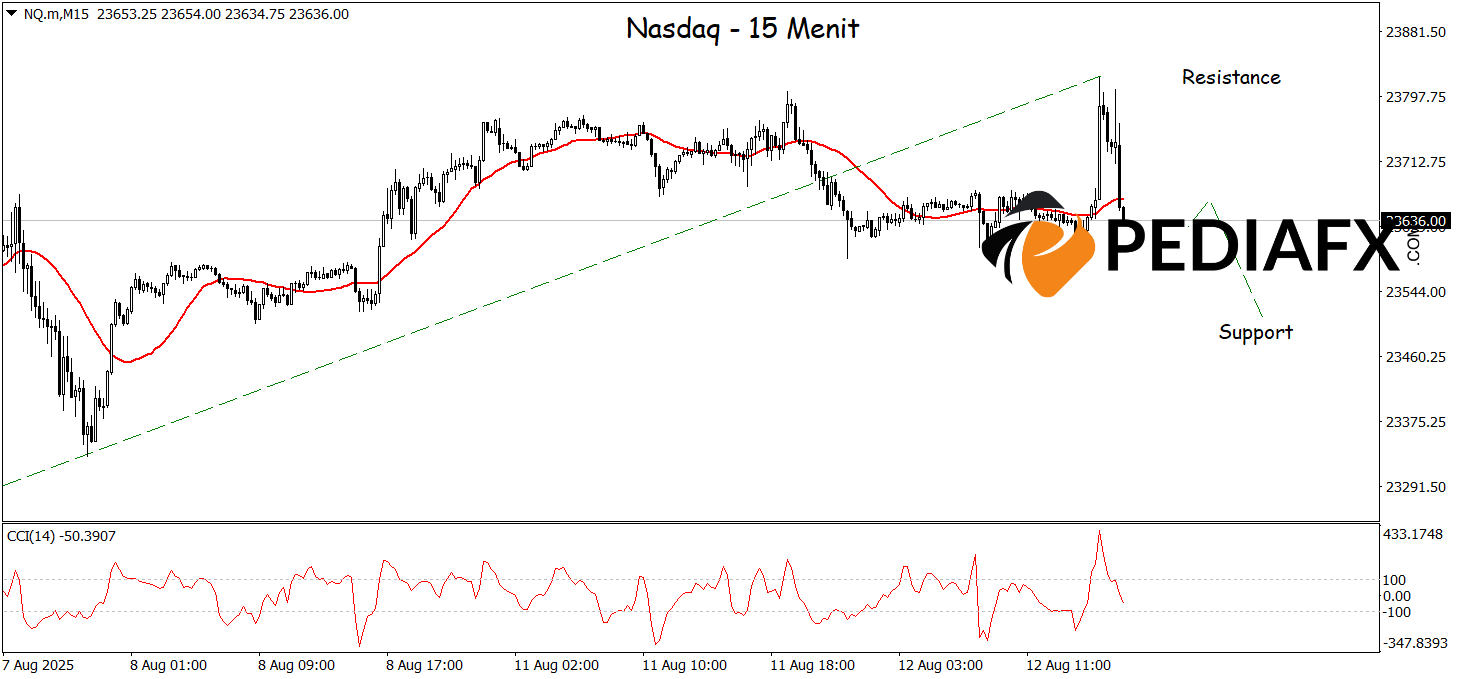
The Nasdaq on the 15-minute timeframe indicates potential weakening after breaking a bullish trendline and forming a new low. The CCI indicator’s descent from the overbought territory suggests a loss of buying momentum, paving the way for short-term selling pressure, with a downward target testing the support level at 23.505.
Technical Reference: sell while below 23.807
Potential Stop Loss 1: 23.745
Potential Stop Loss 2: 23.807
Potential Take Profit 1: 23.565
Potential Take Profit 2: 23.505


