

The price continues to rise on the 1-hour time frame, but signs of weakening are becoming apparent through a bearish divergence signal in the MACD indicator. Despite the price reaching new highs, the MACD histogram is declining, indicating that the bullish momentum is starting to lose strength. This situation often serves as an early warning for the market that the upward trend may reverse, prompting market participants to be more cautious of potential selling pressure in the near term.
The possibility of a downturn is further supported by the Moving Average (MA) now trending downward, providing additional confirmation that the technical bias is shifting towards bearish. If selling pressure continues to increase, the price could enter a deeper correction phase or even begin a new downtrend. This scenario creates strategic opportunities for traders to capitalize on sell momentum when reversal signals are confirmed, while also anticipating a test of important support levels below the current price.
Recommended

Recommended

Recommended

Recommended
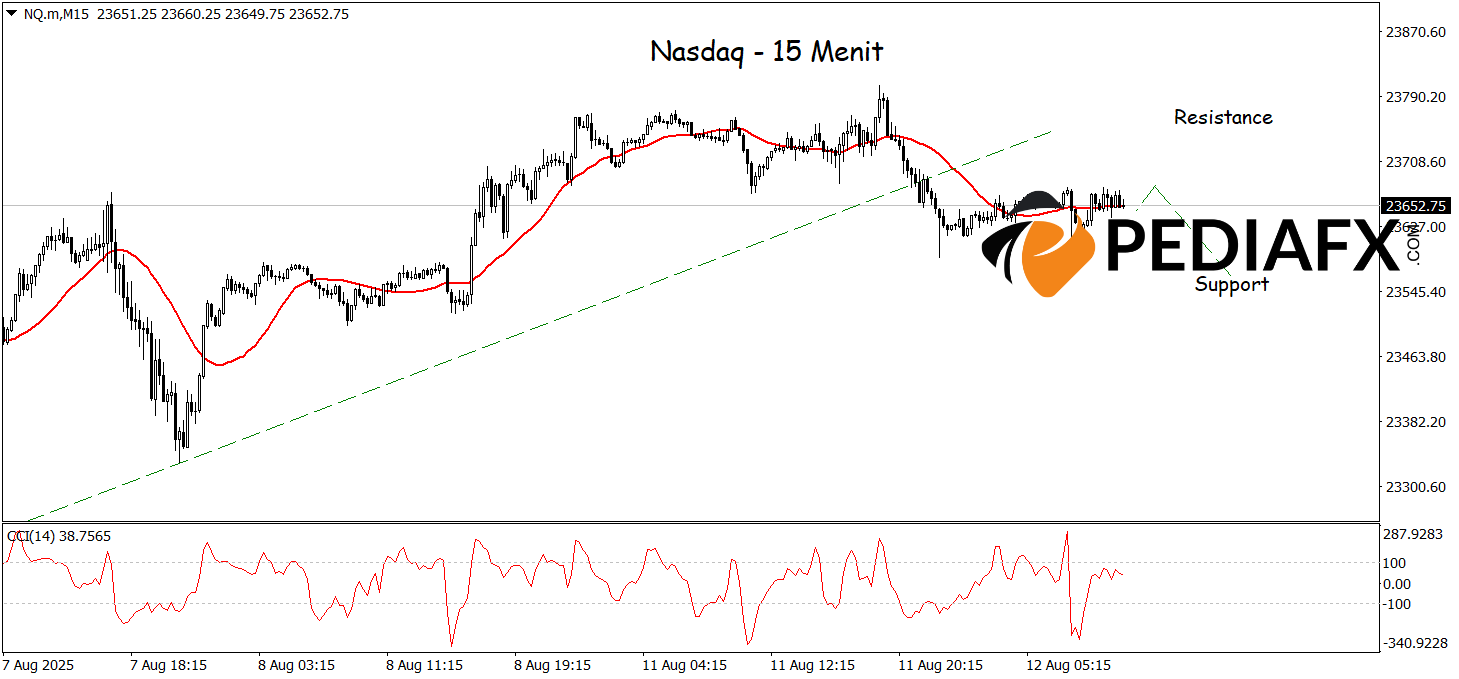
The Nasdaq on the 15-minute time frame exhibits potential for weakness after breaking the bullish trendline and establishing new lower levels. The declining CCI indicator from the overbought region indicates the loss of buying momentum, creating opportunities for selling pressure in the short term. With this combination of technical signals, the Nasdaq is likely to continue its downward trend, aiming to test the support level at 23,565.
Technical Reference: sell while below 23,750
Potential Stop Loss 1: 23,707
Potential Stop Loss 2: 23,750
Potential Take Profit 1: 23,609
Potential Take Profit 2: 23,565


