

The Nasdaq’s performance on the 1-hour timeframe during the US session indicates the formation of a bullish channel, suggesting a strong potential for further upward movement. The zigzag pattern, which illustrates an upward trend structure, reinforces the idea that the market is experiencing a consistent strengthening phase, where each price drop presents an opportunity for buyers to re-enter. This dominance of buying pressure reflects a positive market sentiment towards Nasdaq, with a target to test resistance at higher levels.
Technical support is further solidified by upward-moving Moving Averages (MA) and the MACD indicator remaining in the positive zone. This combination serves as an additional signal that the bullish momentum is well-maintained. As long as prices remain within the upward channel and do not breach significant support, the potential for a continued rally during the US session remains wide open, offering intriguing profit opportunities for market participants who are following this trend.
Recommended

Recommended

Recommended

Recommended
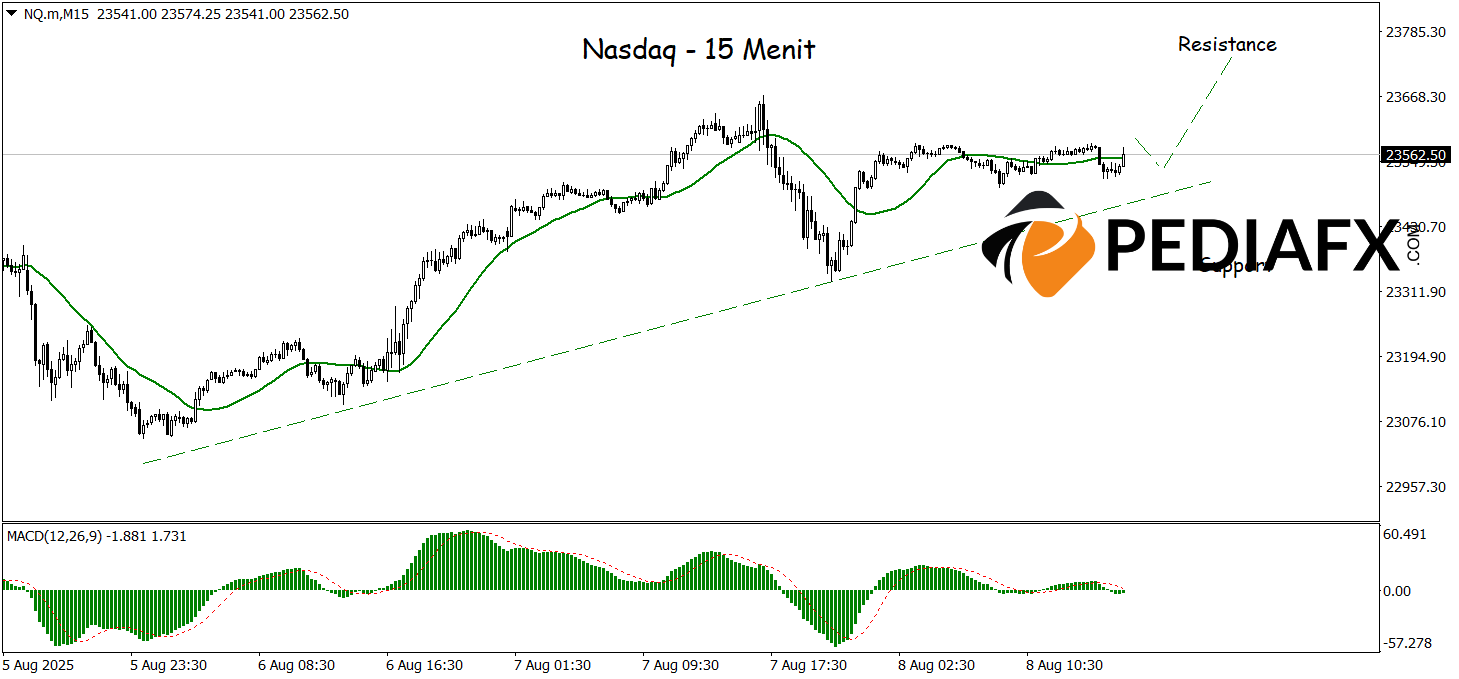
The bullish trendline on the 15-minute timeframe, supported by the MA’s upward trajectory—even if flattening—and the MACD indicator being in the positive area, also suggests that Nasdaq still has an opportunity for growth in the US session. This technical signal combination indicates that buyers continue to have control and could possibly drive prices to test the next resistance level at 23,737.
Technical Reference: buy as long as above 23,373
Potential Take Profit 1: 23,664
Potential Take Profit 2: 23,737
Potential Stop Loss 1: 23,443
Potential Stop Loss 2: 23,373


