

The Nasdaq has suffered a significant drop after retreating from the pullback region highlighted in blue on the hourly chart. This continued decline further solidifies the bearish trend that has emerged, characterized by a consistent lower high and lower low zigzag pattern. The Moving Average (MA), which has begun to curve downward, reinforces the prevailing selling pressure, indicating that any temporary upticks are often exploited by traders for selling activities.
This bearish pressure is backed by the Commodity Channel Index (CCI) indicator, which is currently in the overbought zone, suggesting that prior upward momentum is beginning to wane. As long as prices remain below the pullback area and the MA continues to show a negative slope, the chances for further declines remain plausible.
Recommended

Recommended

Recommended

Recommended
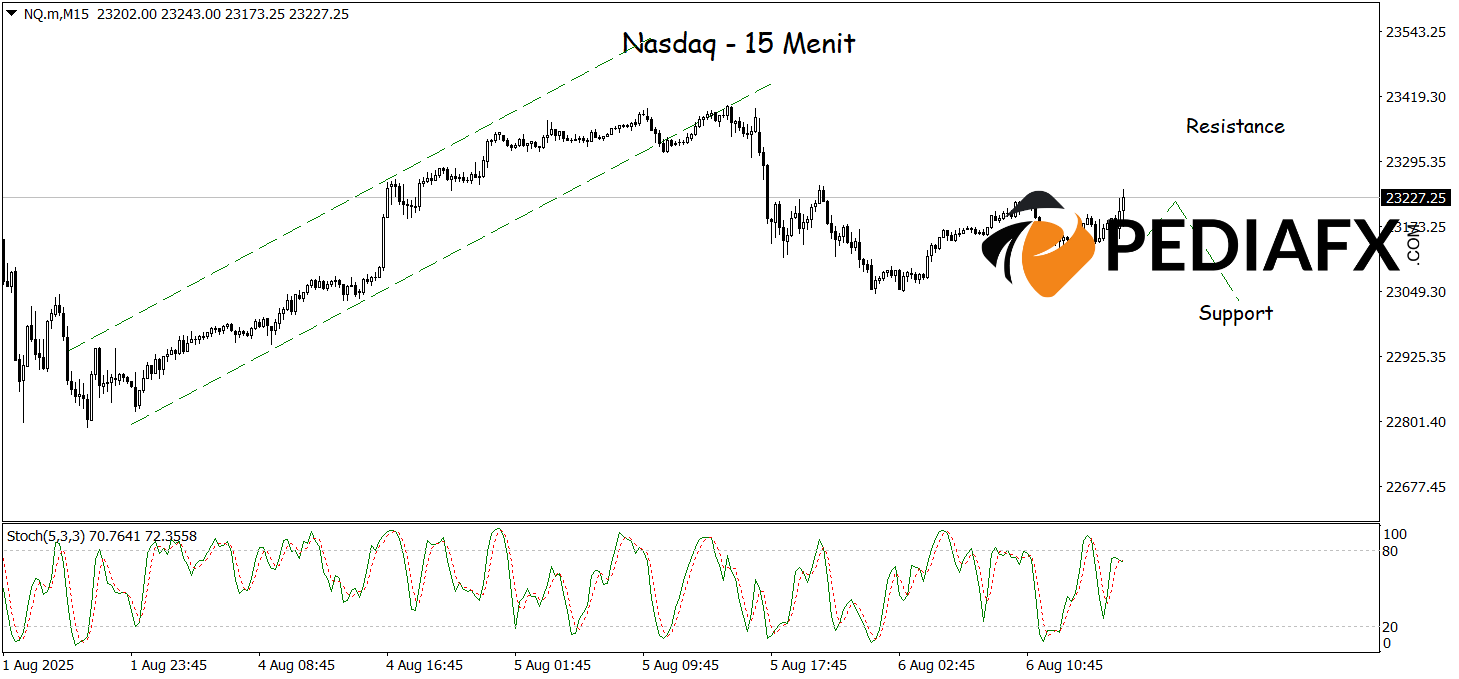
In the 15-minute chart, the break low of the bullish channel adds further signals of weakness, reinforced by the Stochastic indicator sitting in the overbought area. This combination of technical factors opens the door for Nasdaq to continue its decline towards the nearest support level at 23,030.
Technical Reference: sell while below 23,352
Potential Stop Loss 1: 23,298
Potential Stop Loss 2: 23,352
Potential Take Profit 1: 23,095
Potential Take Profit 2: 23,027


