

The Nasdaq reveals a potential for further decline after previously breaking through the lower boundary of the bullish channel on a 1-hour time frame. This break low signifies a shift in market structure from an upward trend to a more bearish sentiment. Currently, prices appear to be undergoing a pullback towards the breakout area, a classic pattern that often presents opportunities for sellers to re-enter the market and drive prices lower. Such pullback patterns frequently mark the beginning of subsequent waves of decline in an ongoing downtrend.
The selling pressure on the Nasdaq is further reinforced by the CCI indicator, which is currently situated in overbought territory. This condition indicates that prices have become excessively high in the short term and are likely to correct downward. With technical confirmation from the pullback pattern and supportive momentum indicators suggesting a continued decline, the potential for Nasdaq to weaken further towards the next support levels is wide open. Traders are advised to monitor price reactions around the breakout area to anticipate valid sell entry opportunities.
Recommended

Recommended

Recommended

Recommended
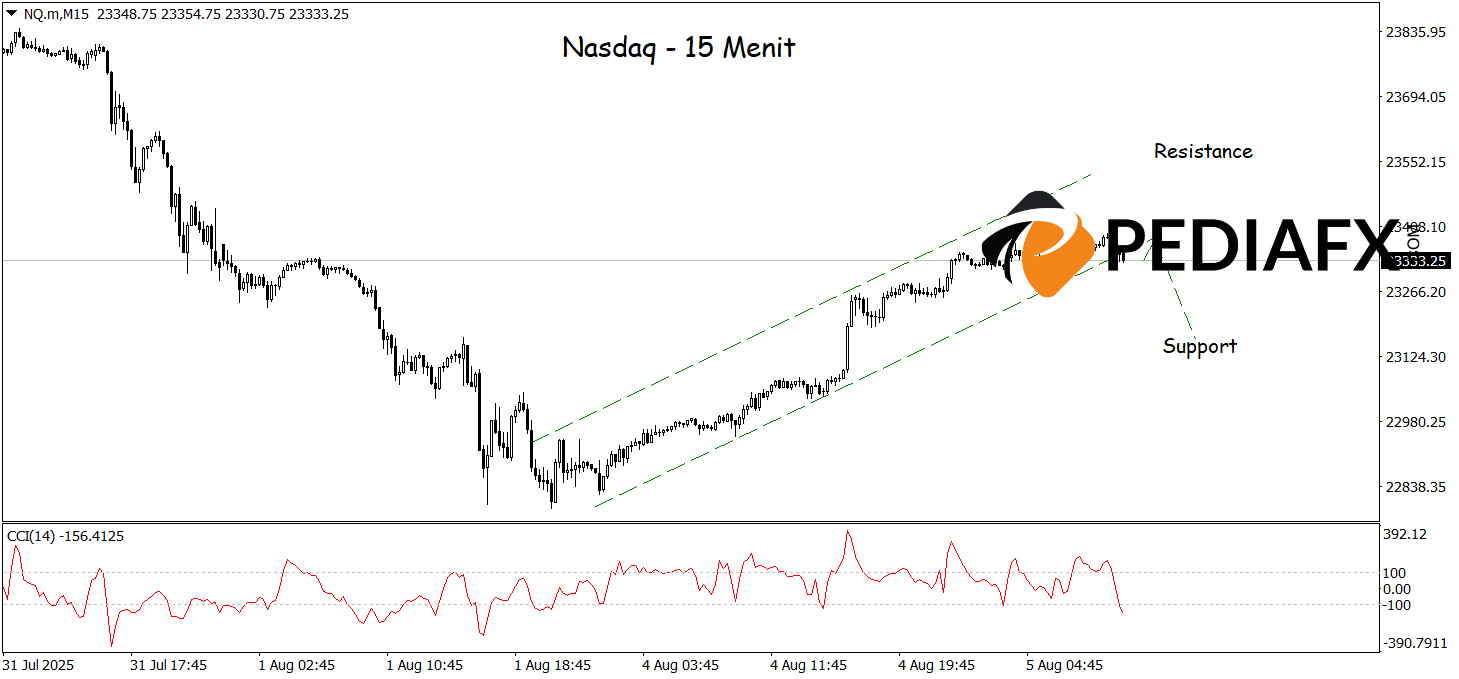
The Nasdaq demonstrates ongoing weakening potential after successfully breaking below the lower limit of the bullish channel on a 15-minute time frame, indicating the end of the short-term upward momentum. Selling pressure intensifies as the CCI indicator sharply declines from overbought levels, signaling that the market is beginning to lose buying strength and opens the door for deeper corrections. With this technical confirmation, the Nasdaq is positioned to further decline towards support at 23,161.
Technical Reference: sell while under 23,542
Potential Stop Loss 1: 23,467
Potential Stop Loss 2: 23,542
Potential Take Profit 1: 23,227
Potential Take Profit 2: 23,161


