

Despite experiencing some corrections in recent sessions, the Nasdaq index continues to exhibit a strong bullish trend, particularly evident on the 1-hour time frame. The zigzag pattern that has formed suggests the presence of higher highs and higher lows, characteristics indicative of a healthy upward trend. Furthermore, the Moving Average (MA) indicator on the 1-hour chart remains oriented upwards, signaling that buying pressure is still predominant in the short term.
This price correction is more accurately viewed as a phase of consolidation or short-term profit-taking rather than a reversal of the trend. As long as prices stay above the MA line and the zigzag formation does not create a new lower low, the chances for a continuation of the upward trend are still highly favorable. Traders may see this correction as an opportunity to enter buy positions as long as technical confirmations continue to support the bullish direction.
Recommended

Recommended

Recommended

Recommended
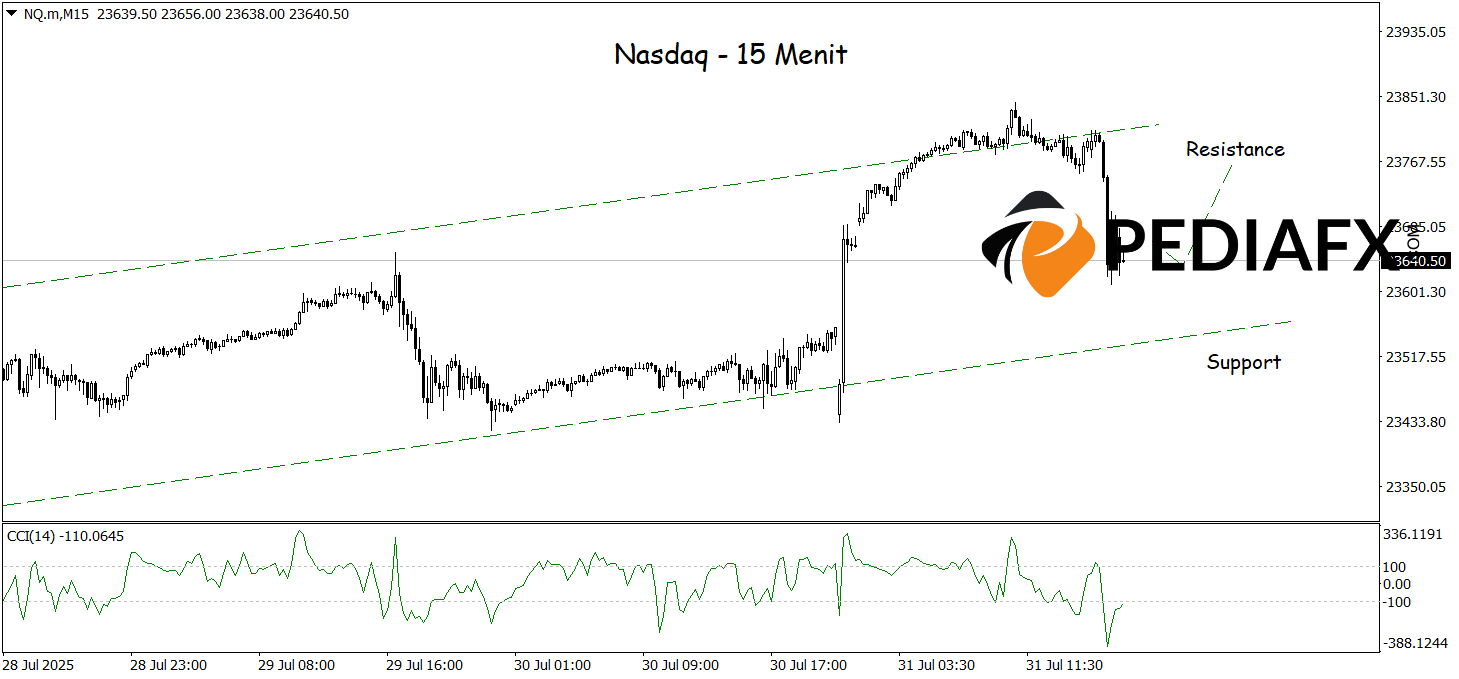
The ongoing bullish channel visible in the 15-minute chart indicates that the Nasdaq remains in a short-term upward trend, with the influence of buyers still strong. The Commodity Channel Index (CCI), which is currently in the oversold territory, provides a signal that the strengthening momentum is still in progress, creating opportunities for the Nasdaq to strengthen again. With this technical backing, the index has the potential to test significant resistance levels around 23,765 in the near future.
Technical Reference: buy while above 23.522
Potential Take Profit 1: 23.712
Potential Take Profit 2: 23.765
Potential Stop Loss 1: 23.566
Potential Stop Loss 2: 23.522


