

The Nasdaq has started exhibiting signs of technical weakness after failing to achieve a new Higher High (HH) on the 1-hour timeframe. Instead of continuing its upward trend, the index has broken through previous low levels, indicating that the bullish momentum is losing its strength. This situation is further corroborated by the position of the Moving Average (MA), which now stands above the current price, acting as a dynamic resistance that holds back any attempts to rebound.
In addition, the ZigZag indicator has begun to display a downward trend, creating a price structure that is lower than before. The combination of these technical signals suggests that the Nasdaq may continue its decline in the short term. If selling pressure persists, the index could test the low area of the previously formed bullish channel, which currently serves as a crucial support level for the continuation of the mid-term trend.
Recommended

Recommended

Recommended

Recommended
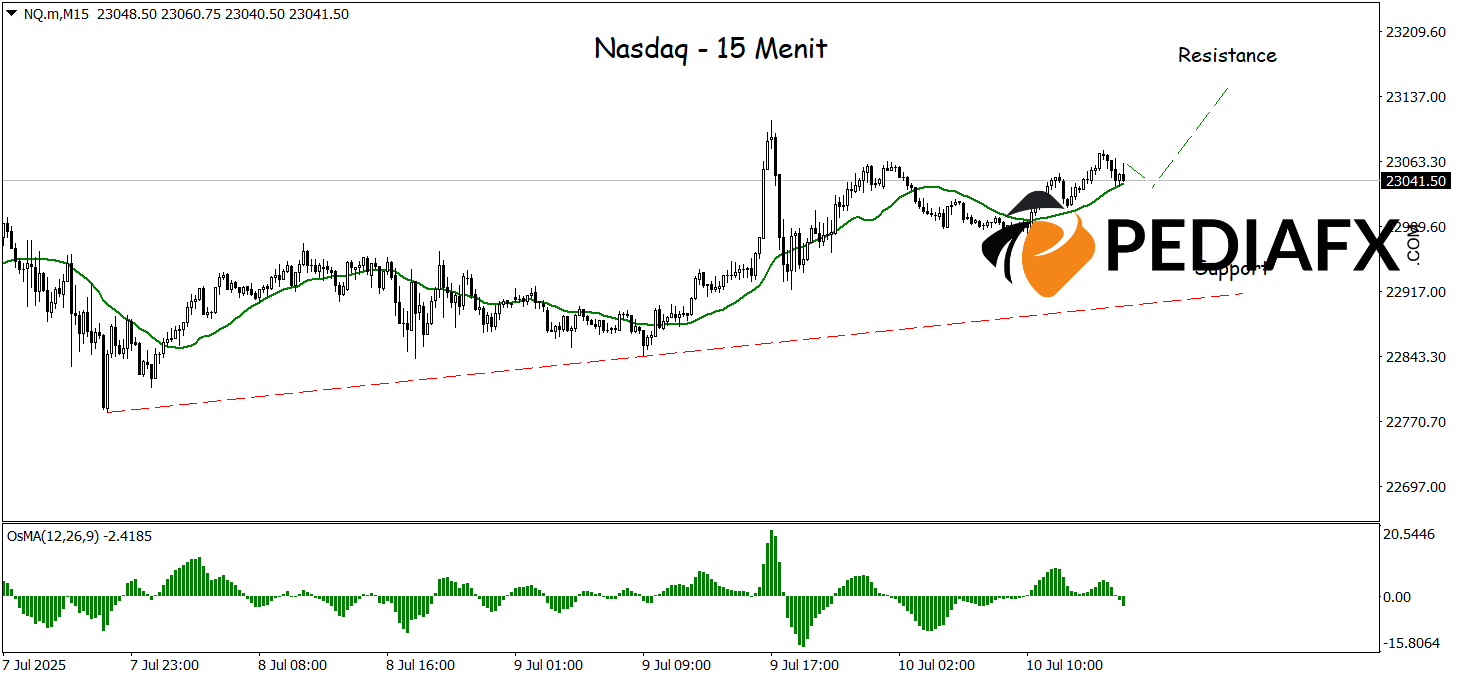
The Nasdaq has begun to display signs of weakening during the European session after successfully breaking below the bullish trendline, indicating a potential shift in trend direction in the near term. This downward pressure is further reinforced by the Moving Average (MA) line that is starting to point downwards, along with the OsMA indicator residing in the negative area, signifying a decline in buying momentum. With this technical confirmation, the Nasdaq has the potential to continue its descent and test the important support area around 22,815.
Technical Reference: sell below 23,025
Potential Stop Loss 1: 22,984
Potential Stop Loss 2: 23,025
Potential Take Profit 1: 22,852
Potential Take Profit 2: 22,815


