

The USDJPY has begun to display technical signs that are leaning towards the bullish trend after successfully breaking through the upper limit of the previous bearish channel that restricted its movement. This breakout is accompanied by the formation of a price structure with Higher Lows (HL) and Higher Highs (HH) on the 1-hour timeframe, indicating a shift in trend from a downward to an upward trajectory.
This strengthening signal is also backed by the Moving Average (MA) indicator, which has started to trend upwards, reinforcing the positive short-term trend direction. On the other hand, the MACD indicator is positioned in the positive zone with an increasing histogram, further solidifying the notion that the buying momentum remains quite robust. As long as this sentiment persists, USDJPY may test the next resistance level.
Recommended

Recommended

Recommended

Recommended
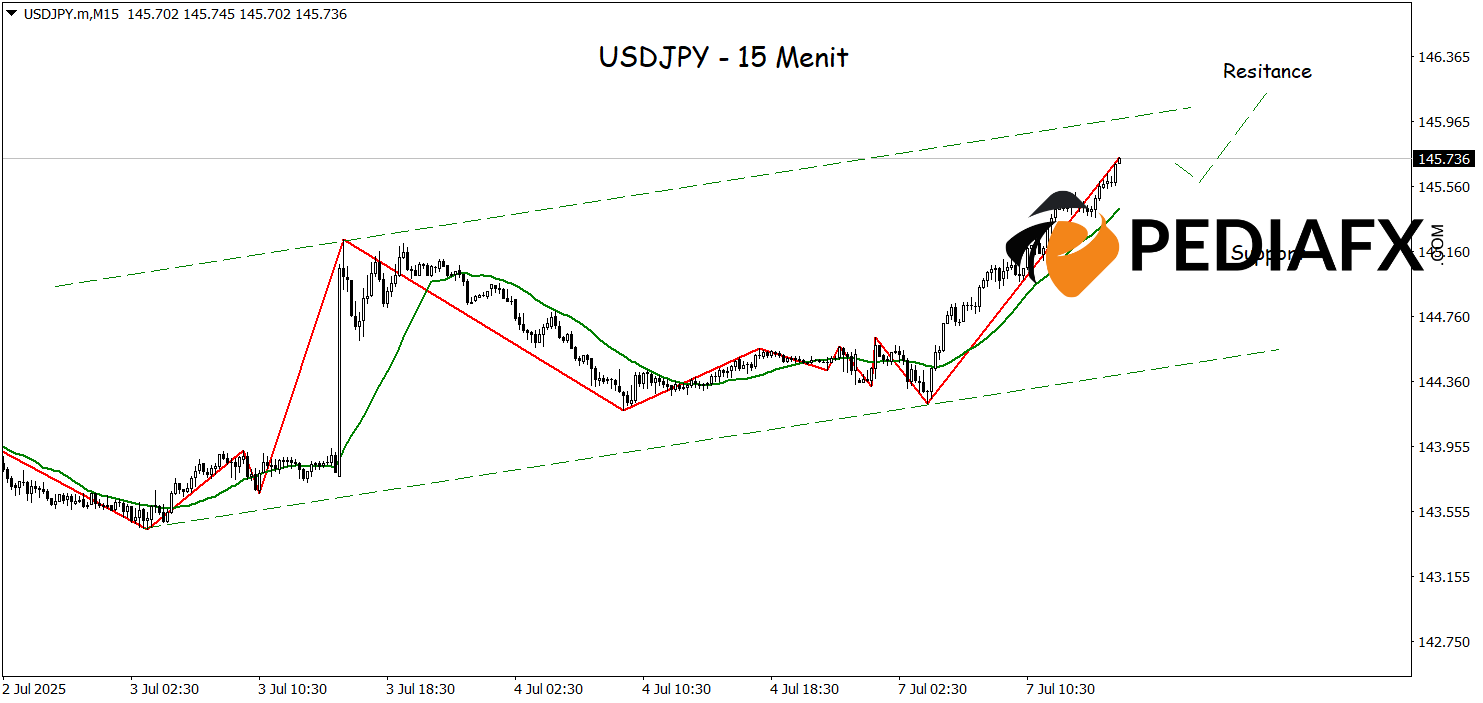
In the 15-minute timeframe, USDJPY is demonstrating a consistent upward pattern, where the ZigZag indicator continues to create points of higher lows (HL) and higher highs (HH), forming a well-defined bullish channel. This structure reflects a stable upward trend, bolstered by the MACD indicator confirming the bullish momentum with the MACD line positioned above the signal line and moving in the positive area. As long as this pattern remains intact without significant pullback pressure, USDJPY has the opportunity to continue its ascent and test the resistance at 146.190.
Technical Reference: buy while above 145.215
Potential Take Profit 1: 145.970
Potential Take Profit 2: 146.190
Potential Stop Loss 1: 145.385
Potential Stop Loss 2: 145.215


