

The USDJPY pair is starting to display signs of a trend reversal after failing to establish a new lower low, which is typically a signal for a continuing downward trend. Rather than weakening further, the price has successfully breached the resistance zone of the bearish channel, creating possibilities for the emergence of a new, more bullish price structure. This breakout above resistance indicates that buying pressure is beginning to strengthen, with buyers gaining traction in the market. This technical structure suggests a potential shift in trend direction from bearish to bullish in the near term.
Additional confirmation can be seen from the MACD indicator on the one-hour timeframe, which is moving into positive territory, signaling the onset of upward momentum. Should the price maintain its position above the breached resistance level and the MACD continues to strengthen, the USDJPY might continue its rally towards subsequent resistance levels.
Recommended

Recommended

Recommended

Recommended
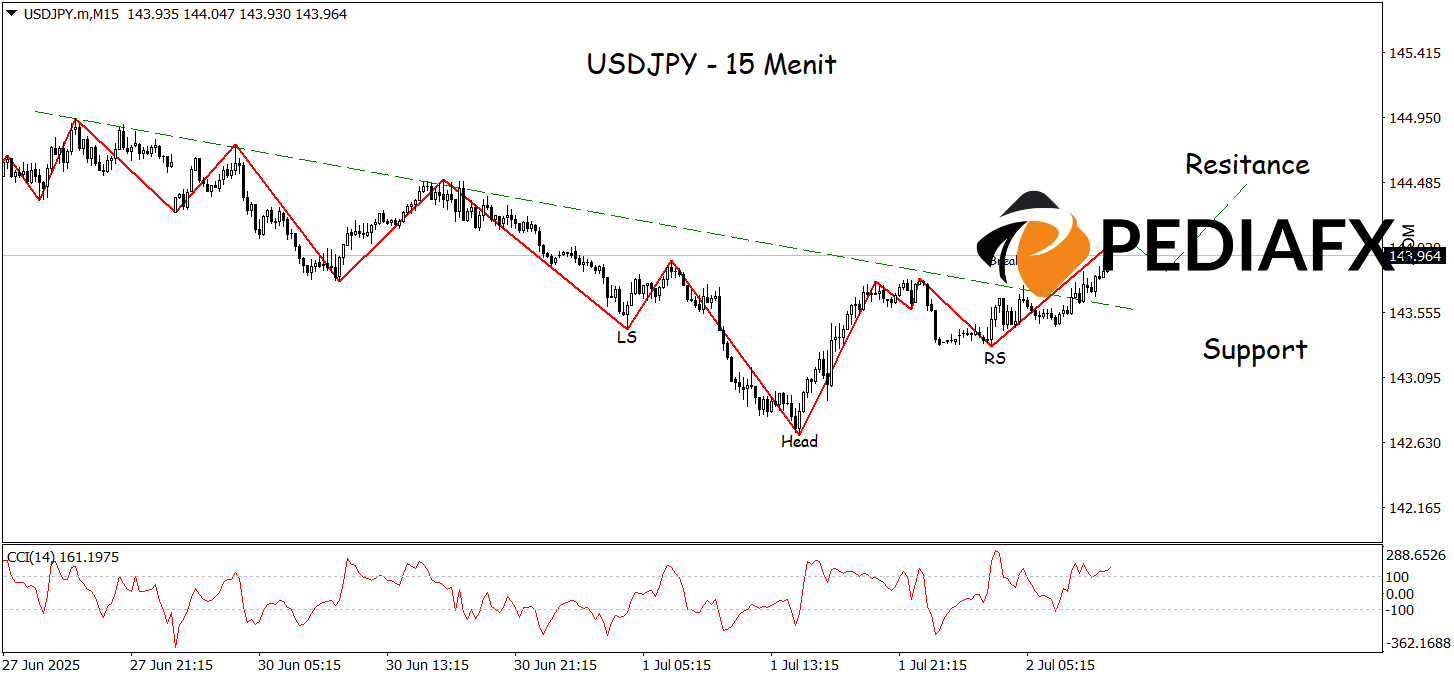
The USDJPY pair shows potential for a short-term reversal after successfully breaking the neckline of the inverted head and shoulders pattern on the 15-minute timeframe. This reversal pattern often serves as an early signal for a change in trend from bearish to bullish. The breach of the neckline indicates that buying pressure is starting to dominate the market, and if the price can sustain itself above this level, further bullish opportunities will likely emerge. This technical formation is of particular interest to traders looking to seize buying opportunities as the trend reversal attempt tests the resistance at 144.485.
Technical Reference: buy when above 143.470
Potential Take Profit 1: 144.255
Potential Take Profit 2: 144.485
Potential Stop Loss 1: 143.685
Potential Stop Loss 2: 143.475


