


The movement of Nasdaq on the 1-hour time frame indicates a consistent bullish trend, characterized by a price structure that repeatedly forms Higher High (HH) and Higher Low (HL) patterns. The established uptrend channel illustrates a clear directional trend, with prices consistently moving along the upper line of the channel as a dynamic resistance limit. Each price correction presents an opportunity for accumulation of purchases, given that the lower channel support and MA line continue to provide valid bounces. This suggests that buyers still dominate the market.
From the indicator perspective, the MACD also displays positive momentum, with the histogram consistently remaining above the zero level and the signal line so far supporting upward movement. Despite encountering a minor weakness, there are no signs of major distribution that could reverse the trend direction. As long as the HH–HL structure is maintained and prices do not significantly break below the channel boundaries, Nasdaq still has the potential to continue rising towards higher resistance levels. This bullish momentum could persist as long as there are no significant negative fundamental surprises.

Recommended

Recommended

Recommended

Recommended
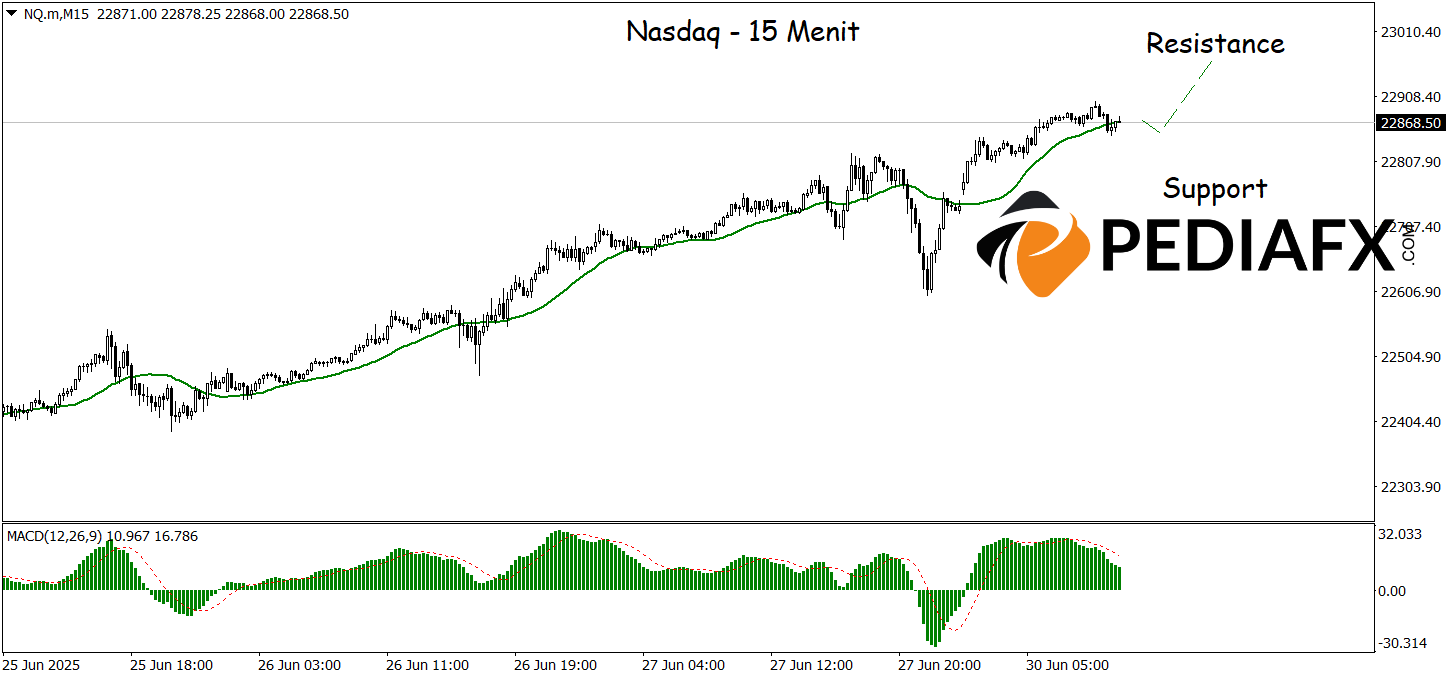
On the 15-minute time frame, Nasdaq still presents opportunities for upward movement, with technical signals supporting the continuation of the bullish trend. The upward-sloping Moving Average (MA) reflects the ongoing strength of the upward trend, while the MACD indicator remains in the positive zone, indicating that buying momentum is still dominant. As long as prices remain above the MA and do not breach support, the potential for continuation of the uptrend remains wide open, targeting the nearest resistance area at 22,960.
Technical Reference: buy as long as above 22,780
Potential Take Profit 1: 22,922
Potential Take Profit 2: 22,960
Potential Stop Loss 1: 22,825
Potential Stop Loss 2: 22,785








