


The Nasdaq is currently exhibiting a robust upward trend on the 1-hour time frame, maintaining a consistent bullish structure. A series of consistent Higher Lows (HL) continues to form, indicating that buyers are still in control of price movements, with each correction providing a buying opportunity. This pattern serves as a crucial foundation for the continuation of the trend, as long as the price does not break below the previous HL, the upward direction remains technically valid.
Additional support comes from the Zigzag indicator, which displays a clear upward pattern alongside price positioning above the Moving Average line, emphasizing the dominance of the bullish momentum. These two indicators strengthen the belief that the Nasdaq still has room to continue its ascent in the near future.

Recommended

Recommended

Recommended

Recommended
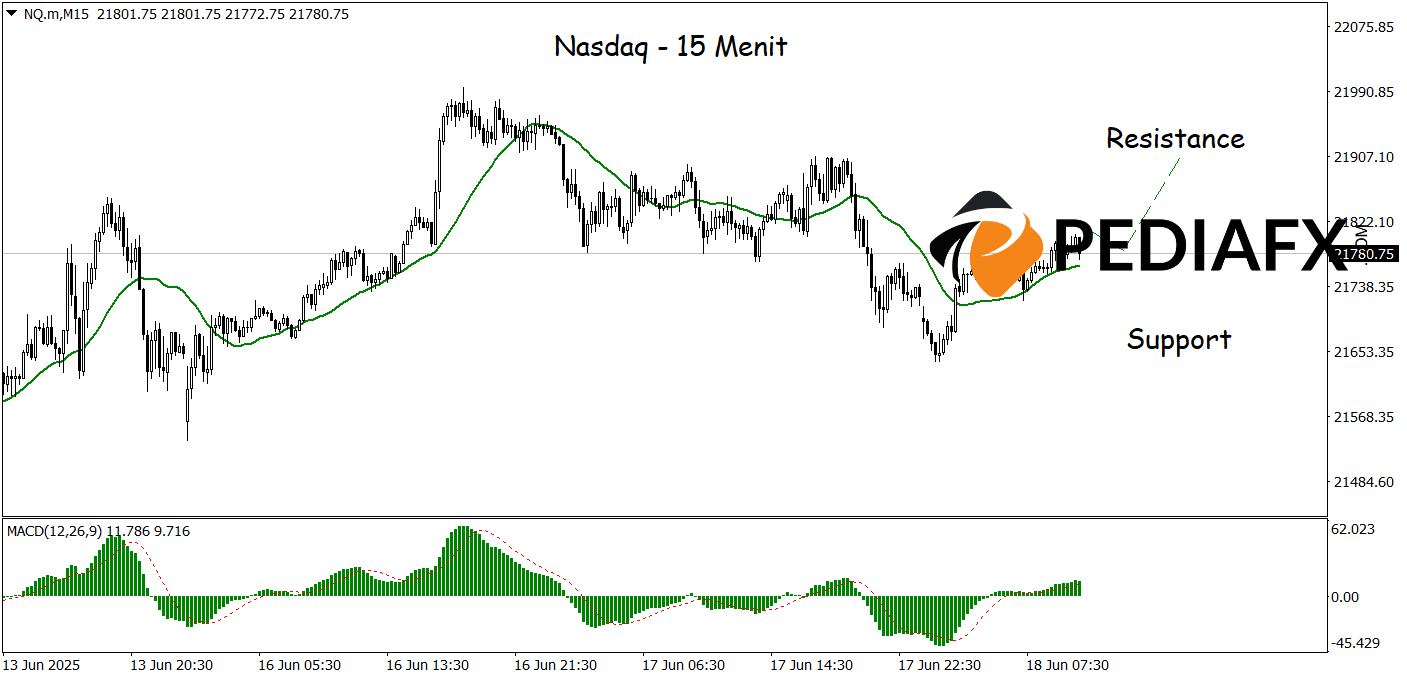
On the 15-minute time frame, the Nasdaq demonstrates the potential for trend continuation supported by solid technical indicators such as the Moving Average (MA) and MACD. The price consistently remains above the MA, reflecting a short-term trend that remains bullish, while the MACD indicates positive territory with its signal line trending upwards, reinforcing buying momentum. The combination of these indicators suggests that buying support is still dominant, testing the level of 21,905.
Technical Reference: buy as long as above 21,678
Potential Take Profit 1: 21,855
Potential Take Profit 2: 21,905
Potential Stop Loss 1: 21,725
Potential Stop Loss 2: 21,678








