


The Nasdaq’s movement on the 1-hour timeframe indicates a recovery attempt after facing selling pressure that pushed prices out of an ascending channel. Despite the formation of a lower high (LH) and a lower low (L), prices are currently attempting to rise again and have successfully broken through the short-term trendline resistance (dotted red line).
Strength validation is also evident from the CCI indicator, which has climbed above the 100 level, reflecting a recovery in buying momentum. If the price can maintain its position above this breakout area and form a new higher low (HL), there is potential for the Nasdaq to continue rising towards the resistance area.

Recommended

Recommended

Recommended

Recommended
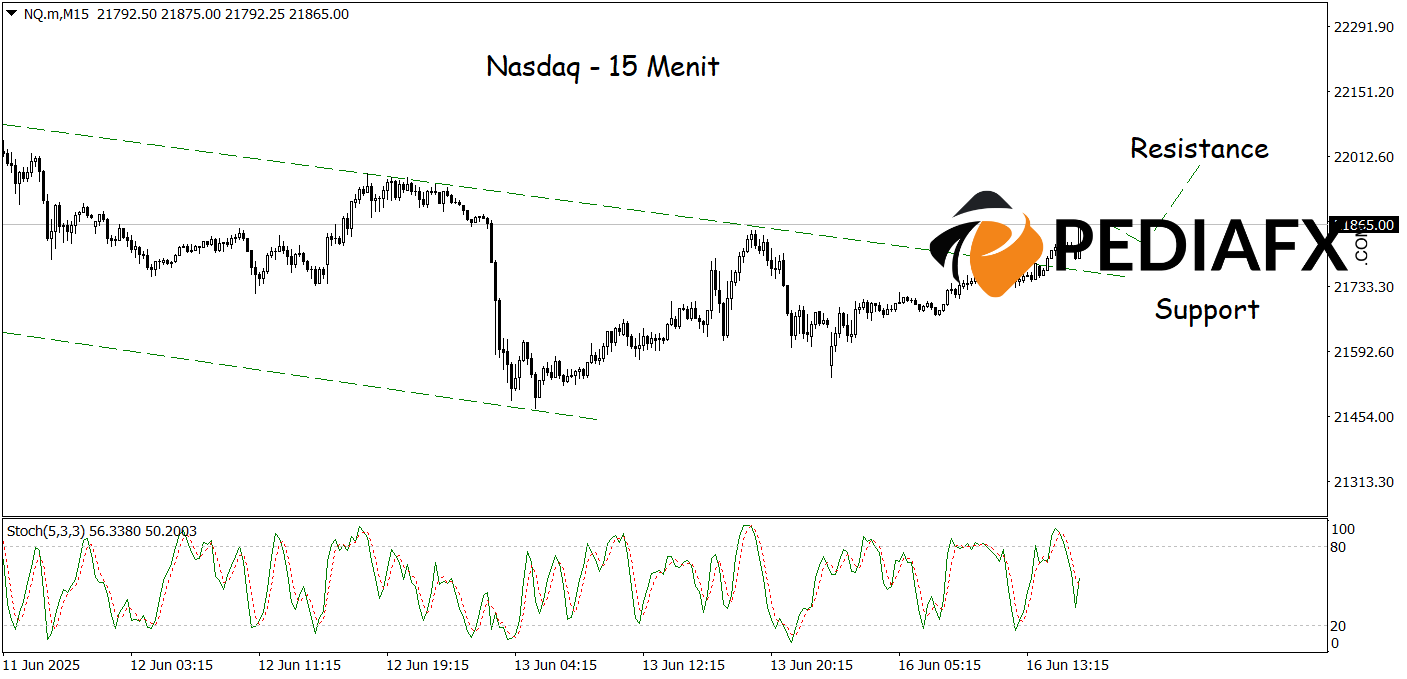
In the 15-minute timeframe, the Nasdaq shows early reversal signals after successfully breaching the descending channel resistance line. This breakout highlights potential short-term strengthening, especially if prices can stay above the newly established support area formed by this trendline. The Stochastic indicator, which has been rising from the midpoint, supports the current positive momentum, offering a chance for continued increases to test 21,995.
Technical References: buy above 21,713
Potential Take Profit 1: 21,925
Potential Take Profit 2: 21,995
Potential Stop Loss 1: 21,785
Potential Stop Loss 2: 21,713








