


The movement of the Nasdaq index on the 1-hour chart reveals signs of weakening after it failed to maintain an upward trend at the upper boundary of the channel. A sharp decline in recent hours has breached the midpoint of the channel, while the MACD indicator signals a strengthening bearish momentum. The widening MACD histogram extending into negative territory points to persistent selling pressure. Should this pressure continue, the likelihood of the price testing the lower support line of the channel remains considerable.
Dynamic support around the 21,720 mark is attracting the attention of intraday traders. If the price can hold above this level, the potential for a technical rebound still exists. Conversely, if this level fails to contain the decline, Nasdaq may face deeper corrections, particularly if accompanied by increased selling volume.

Recommended

Recommended

Recommended

Recommended
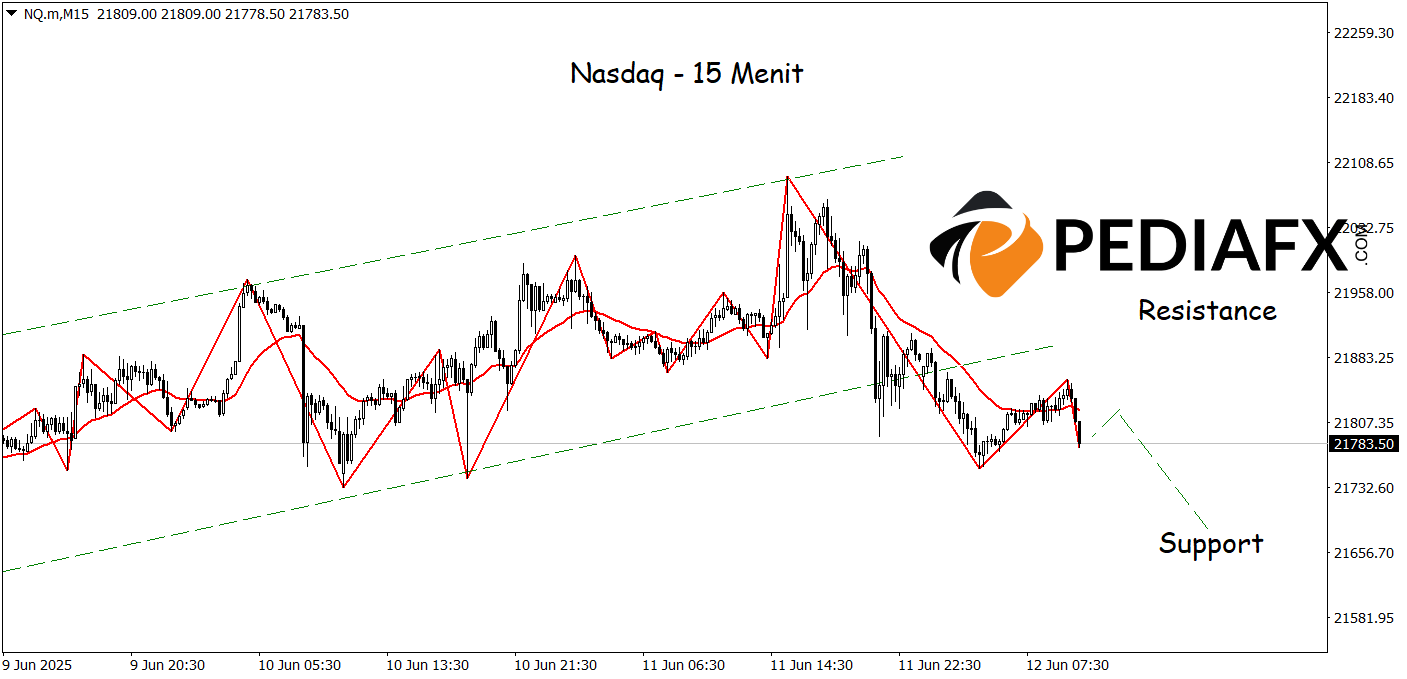
The Nasdaq’s behavior on the 15-minute time frame indicates a resurgence of selling pressure after prices failed to break through the minor resistance area around 21,830. The sharp decline signifies a continuation of weakness in the intraday structure, with prices once again descending within the downtrend channel. If selling pressure persists, the support area at the 21,650 level could become the next target.
Technical Reference: sell while below 21,920
Potential Stop Loss 1: 21,885
Potential Stop Loss 2: 21,920
Potential Take Profit 1: 21,715
Potential Take Profit 2: 21,650








