


The Nasdaq index is displaying signs of recovery after experiencing significant selling pressure that pushed prices to the lower Bollinger Bands on the 1-hour time frame. This rebound is occurring in a region commonly recognized as oversold, prompting short-term buying interest. The upward price movement from this lower threshold signals the potential for a reversal or at least a technical correction following a substantial decline. The price action at this level is crucial to confirming the strength of buyers in maintaining momentum.
Strength is also becoming evident from various supporting technical indicators. If buying pressure persists and prices manage to breach the nearby minor resistance, the likelihood of further gains will increase toward the midline area or even the upper Bollinger band.

Recommended

Recommended

Recommended

Recommended
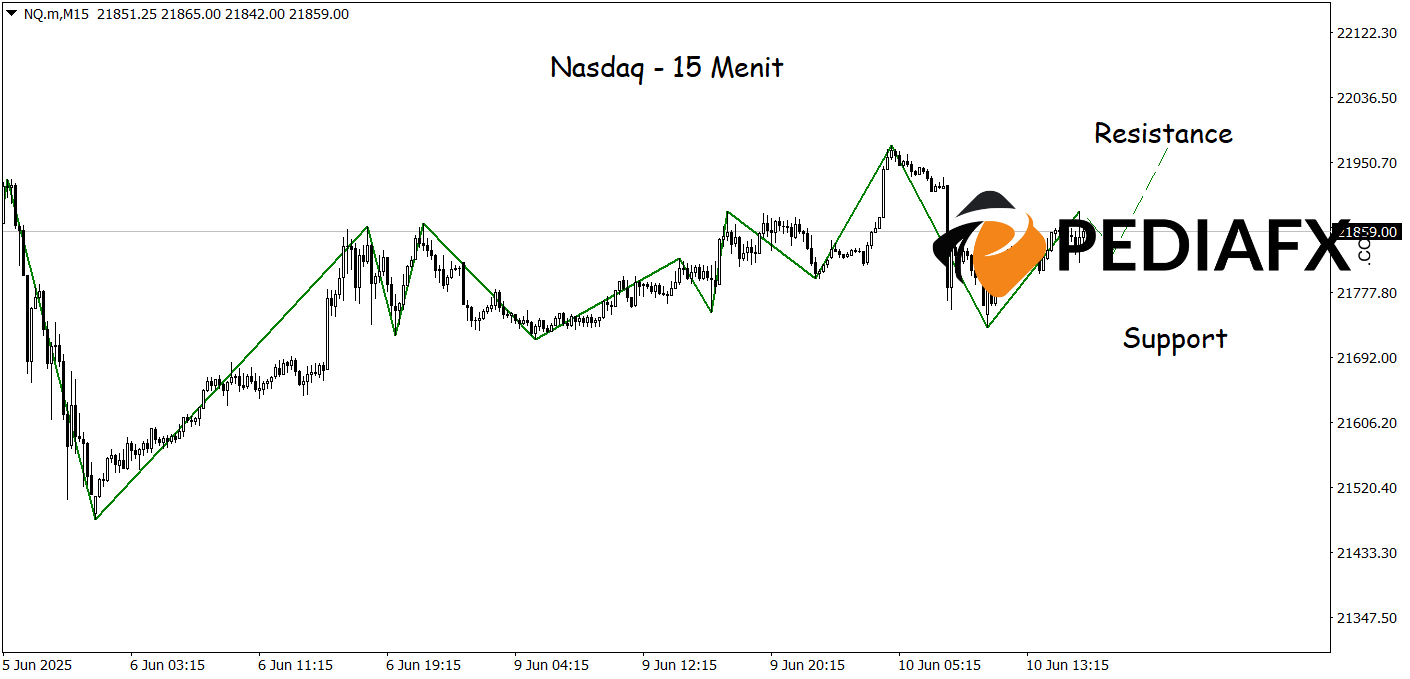
The Nasdaq is establishing a bullish structure on the 15-minute time frame, indicating potential for a continued upward trend in the short term. The price action exhibits a pattern of higher lows and higher highs, while the Zigzag indicator remains supportive of a strengthening trend with consistent upward wave retracements. As long as prices hold above the dynamic support and fail to form new lower lows, the chances for further gains remain open to test 21,970.
Technical Reference: buy while above 21,730
Potential Take Profit 1: 21,930
Potential Take Profit 2: 21,970
Potential Stop Loss 1: 21,780
Potential Stop Loss 2: 21,730








