

The USDJPY currency pair is currently experiencing downward pressure as three main technical indicators—ZigZag, Moving Average (MA), and MACD—concurrently suggest potential further declines. The ZigZag indicator has formed a sequence of lower highs and lower lows, reflecting a market that is steadily shifting downward. Additionally, the MA line on the hourly time frame displays a negative slope, with prices consistently remaining below it, signaling the dominance of sellers and a lack of short-term recovery strength.
Furthermore, the MACD indicator reinforces this bearish outlook with its line positioned below the signal line and a histogram generating deeper negative bars. This condition indicates that selling momentum is still active, with no definitive signs of a reversal at this time. With these three technical signals aligned, USDJPY is likely to continue its decline towards the next support area.
Recommended

Recommended

Recommended

Recommended
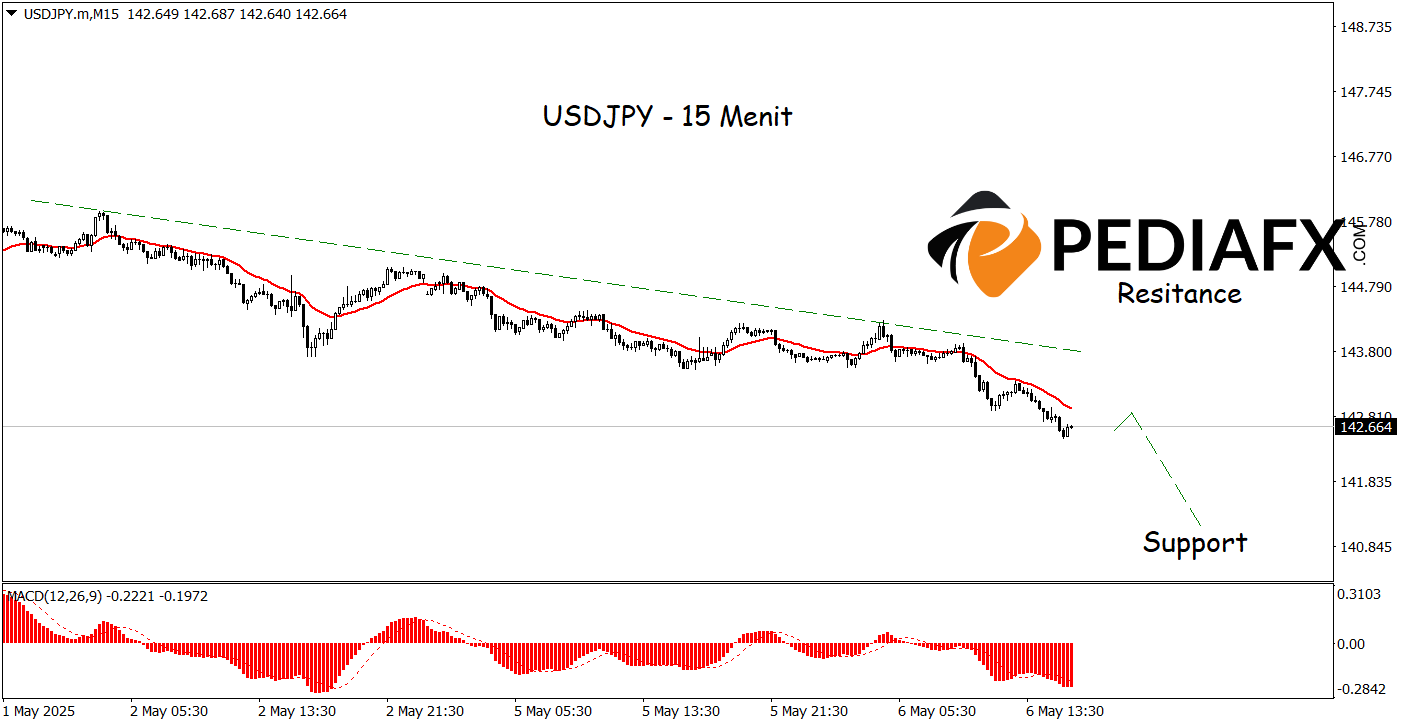
On the 15-minute time frame, the currency pair shows increasing bearish strength after the establishment of a clear downward trendline, indicating that prices are moving within a declining pattern. The Moving Average (MA) is currently trending downwards, further reinforcing the signal that selling pressure is prevailing in the market. Additionally, the MACD indicator confirms the potential for a decline, as the MACD line moves lower and crosses below the signal line, while the MACD histogram prints increasingly wider negative bars. The combination of these three elements signifies a heightened chance of price declines in the 15-minute time frame, testing the 141.070 level.
Technical Reference: Sell while below 144.520
Potential Stop Loss 1: 143.985
Potential Stop Loss 2: 144.520
Potential Take Profit 1: 141.500
Potential Take Profit 2: 141.075


