

The USDJPY currency pair seems to indicate further decline following a downward movement to the lower Bollinger Bands, suggesting that selling pressure remains strong. A limited rebound around this level reinforces the downtrend scenario, with prices likely heading towards the next lower band. If the price manages to breach the support level, a deeper decline could ensue.
The MACD indicator also provides a clearer bearish signal, with the MACD line descending and positioned below the signal line. This indicates that downward momentum is gaining strength, presenting the potential for lower price movements in the short term. The negative values shown in the MACD histogram further confirm that selling pressure is more pronounced.
Recommended

Recommended

Recommended

Recommended
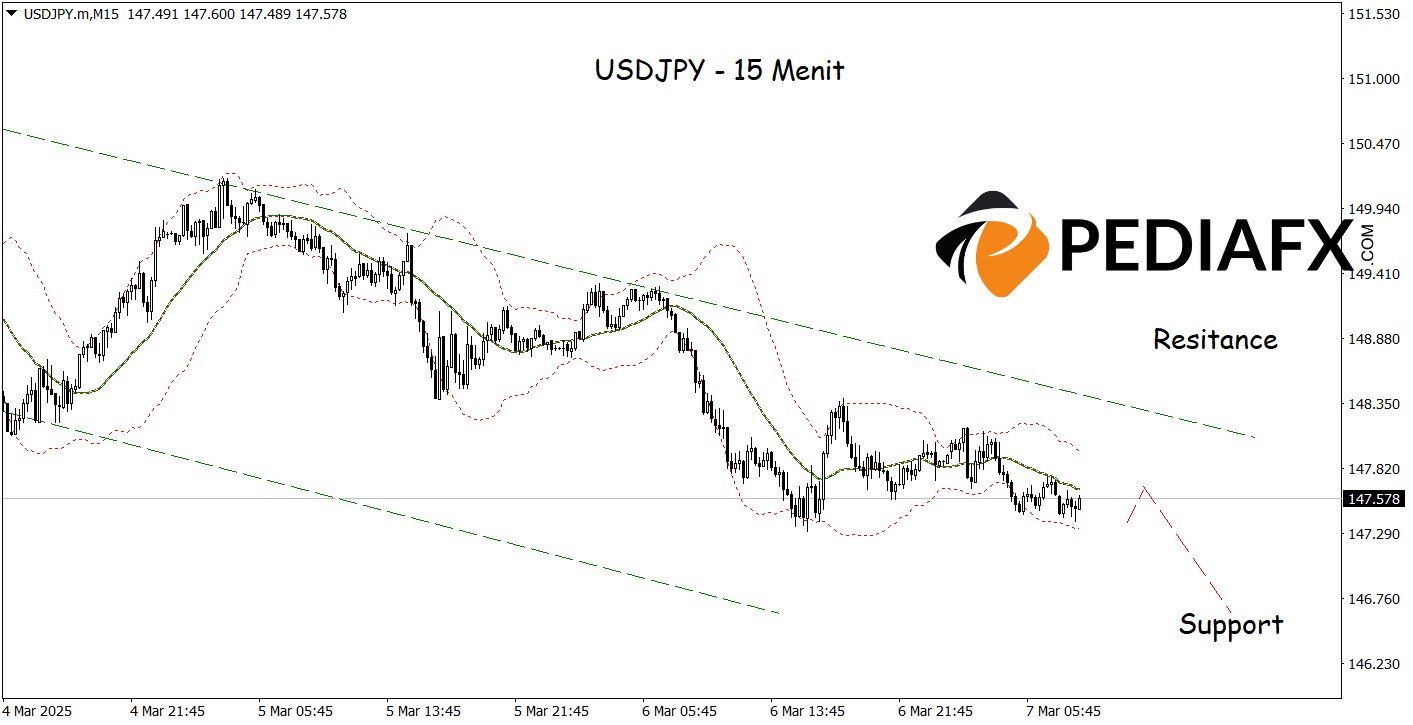
The USDJPY continues to be trapped in a bearish channel, with Bollinger Bands pointing downwards on the 15-minute timeframe, indicating prevailing selling pressure. Price movements remaining below the middle Bollinger Bands suggest that the bearish momentum is still intact, while the widening of the bands indicates an increase in volatility that could accelerate deeper declines towards the support level of 146.625.
Technical Reference: sell while below 148.750
Potential Stop Loss 1: 148.420
Potential Stop Loss 2: 148.750
Potential Take Profit 1: 147.025
Potential Take Profit 2: 146.625


