

The USDJPY pair encountered downward pressure during the European trading session as it successfully breached the lower boundary of the Bollinger Bands, often signaling a potential further decline. This downward movement is corroborated by the MACD (Moving Average Convergence Divergence) indicator, which presents a clear bearish signal. With the MACD positioned below the signal line, selling pressure is becoming increasingly dominant, confirming that USDJPY may continue its downward trajectory.
Should the price continue descent and penetrate critical support levels, it is highly likely that this currency pair will test the next support zone. The Bollinger Bands are increasingly directed downward, and the MACD signals further bearish momentum.
Recommended

Recommended

Recommended

Recommended
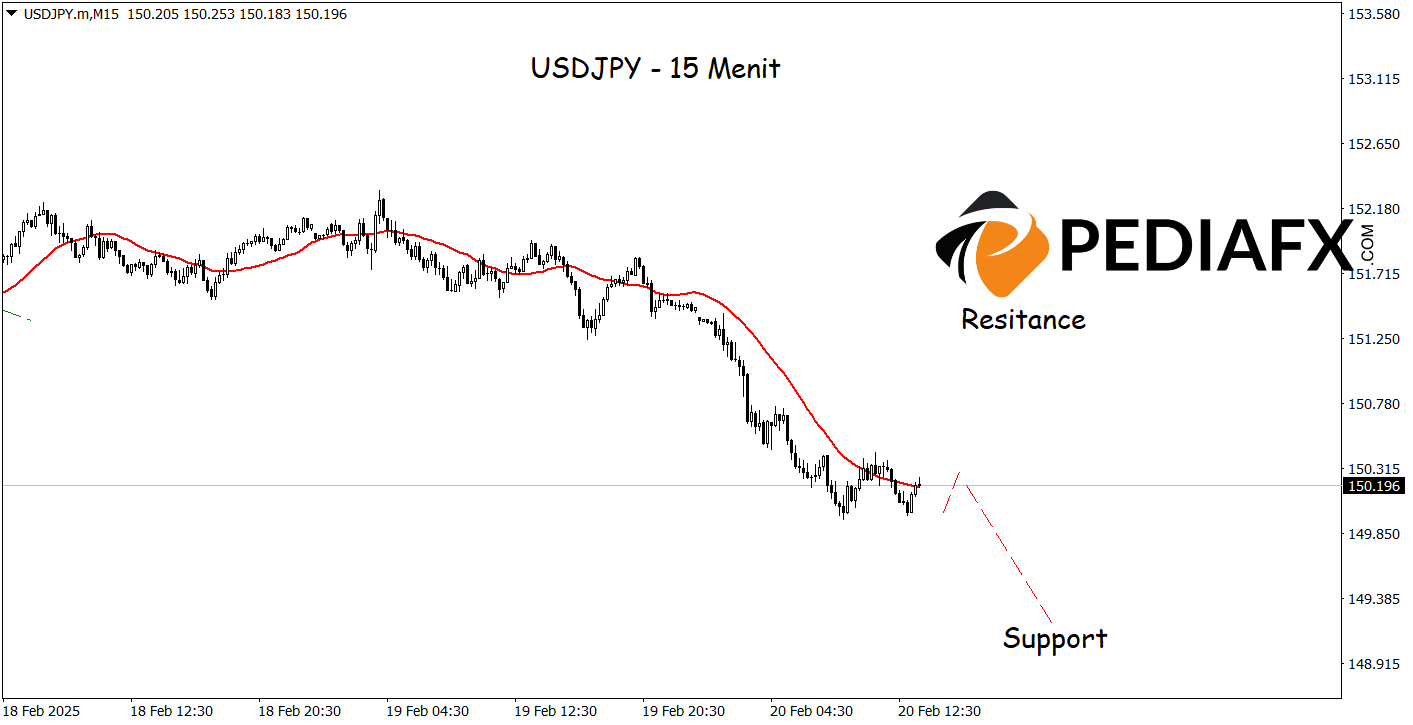
In the 15-minute time frame, USDJPY exhibits signs of weakening as the Moving Average (MA) has sharply declined, suggesting that the bearish momentum is strengthening. This drop in the MA often serves as an early indication that prices will likely continue their downward trend, leading to potential further corrections in the USDJPY movements. Additionally, a price drop beneath the support level of 149.195 has been observed.
Technical Reference: sell when below 151.285
Potential Stop Loss 1: 150.895
Potential Stop Loss 2: 151.285
Potential Take Profit 1: 149.560
Potential Take Profit 2: 149.195


