

The USDJPY is currently situated within a notably dominant bearish channel, with prices consistently confined within the lower boundaries of this channel. This pattern indicates significant selling pressure, reflecting that sellers are in control of the market. Moreover, the Stochastic indicator reveals an overbought condition, which further enhances the likelihood of a price correction occurring.
When the price reaches overbought levels, it often serves as a signal that the bullish momentum is dwindling, and additional downward movement may be on the horizon. Therefore, the combination of the bearish channel alongside the overbought situation on the Stochastic points to a strong indication that the USDJPY could continue to decline.
Recommended

Recommended

Recommended

Recommended
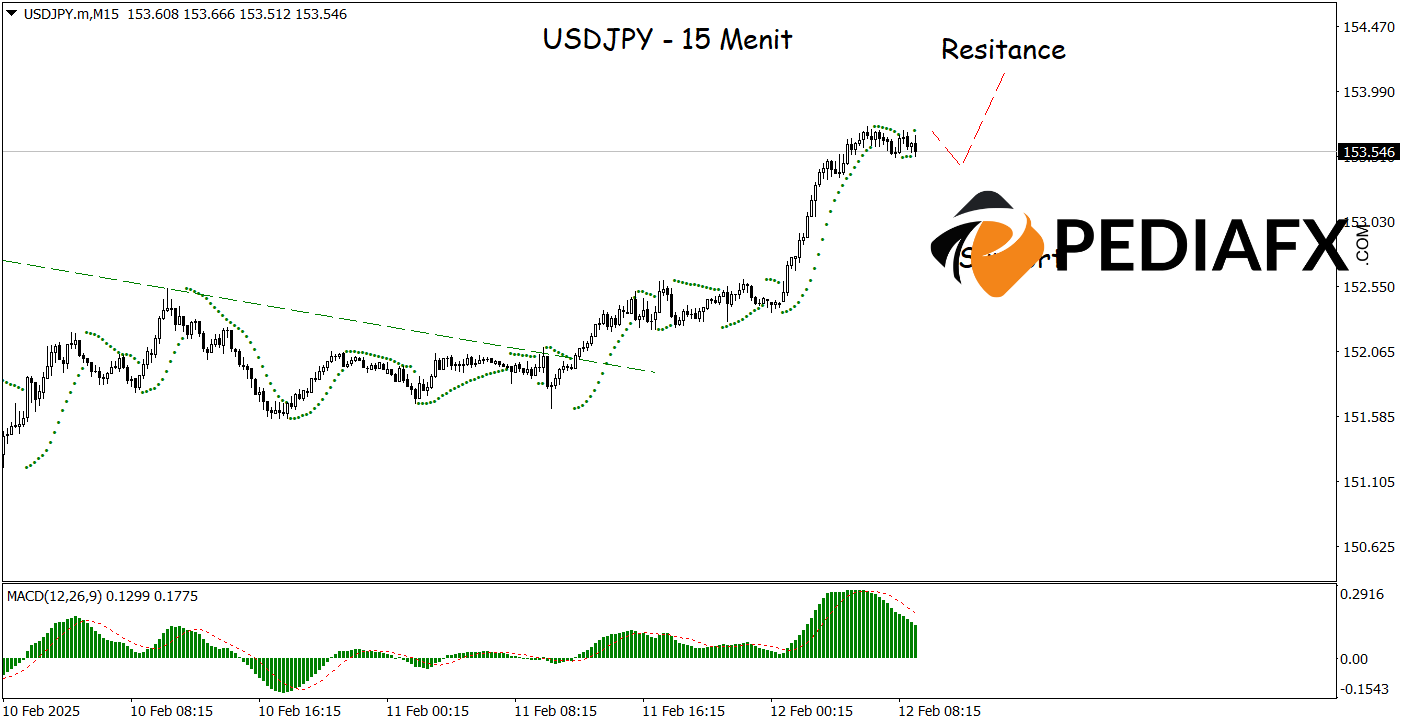
On the 15-minute chart, the USDJPY presents a solid bullish signal as the Parabolic SAR indicates a reversal trend upwards, suggesting that prices are likely to rise soon. Additionally, the MACD indicator reinforces the expectation of an increase, with the MACD line positioned above the signal line and the histogram indicating positive momentum. This combination of indicators confirms the presence of bullish strength, potentially pushing the price to test the resistance level at 154.145.
Technical Reference: buy if above 152.920
Potential Take Profit 1: 153.930
Potential Take Profit 2: 154.145
Potential Stop Loss 1: 153.170
Potential Stop Loss 2: 152.920


