

The USDJPY is currently experiencing intense supply pressure, highlighted by a break below the lower Bollinger Bands. Such a breach signals significant bearish momentum, pushing prices outside the usual volatility range. The midline of the Bollinger Bands now acts as a dynamically shifting resistance, reinforcing the ongoing downward pressure.
The MACD indicator further supports the bearish trend, with an increasing negative histogram and the MACD line positioned well below the signal line. This combination of indicators suggests that USDJPY could continue its downward trajectory.
Recommended

Recommended

Recommended

Recommended
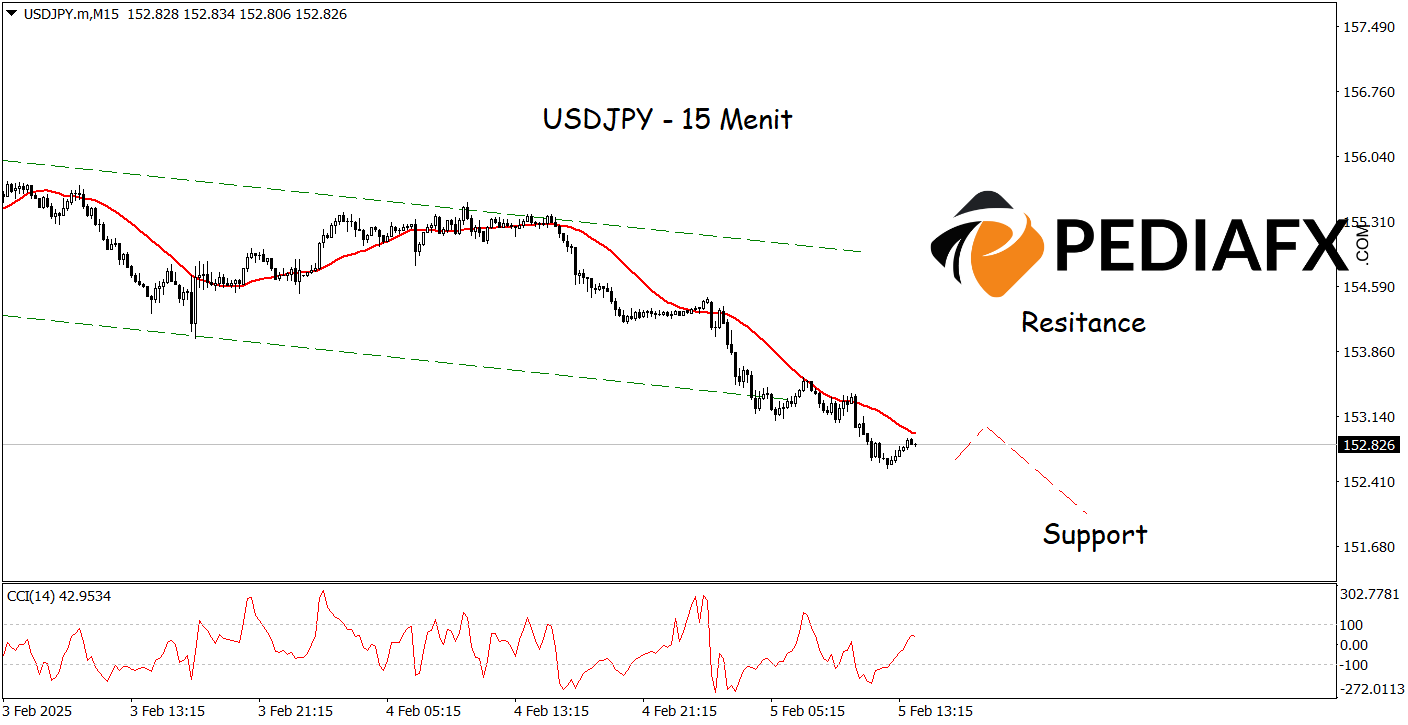
Moreover, USDJPY exhibits strong bearish signals on the 15-minute timeframe, with the Moving Average (MA) indicator confirming the price decline. The consistent position of the price below the MA line indicates dominant selling pressure. Additionally, the Commodity Channel Index (CCI) reinforces the likelihood of further decreases, as its value remains below -100, suggesting a persistent oversold condition. Should this scenario unfold, USDJPY may test the support level at 152.400.
Technical Reference: sell while below 154.050
Potential Stop Loss 1: 153.600
Potential Stop Loss 2: 154.050
Potential Take Profit 1: 152.400
Potential Take Profit 2: 151.980


