


The price of gold exhibits signs of recovery after reaching the lower boundary of the Bollinger Bands, indicating a potential trend reversal. Additionally, the Stochastic indicator, currently positioned in the oversold zone, suggests that selling pressure has been excessive, and prices are poised for a rebound. Should this indicator move out of the oversold region and create an upward crossover, it would further bolster the bullish outlook.

Recommended

Recommended

Recommended

Recommended
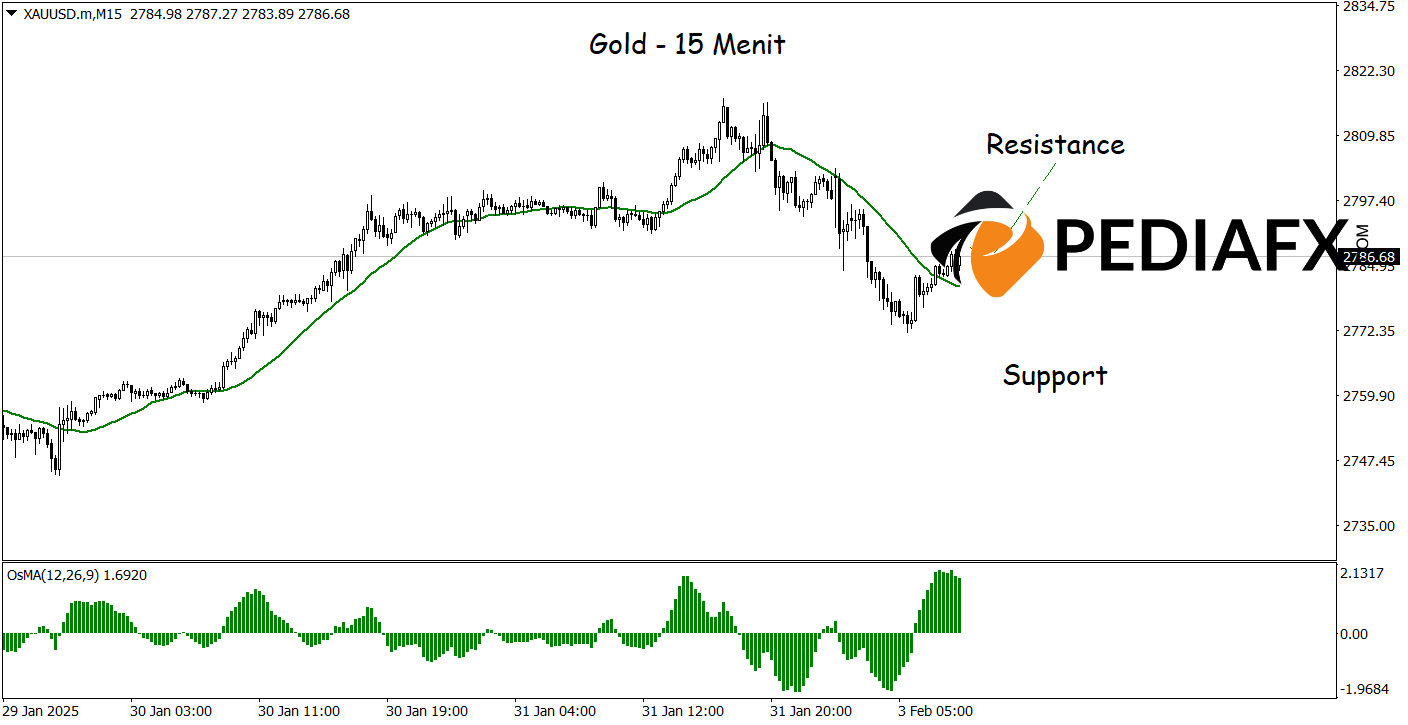
Currently, gold is trading above the Moving Average (MA) on the 15-minute timeframe, reflecting a short-term bullish trend. Furthermore, the OSMA indicator displays positive momentum, indicating the possibility of continued price increases. If the price remains above the MA and the OSMA continues to signal positively, gold may have the opportunity to test the nearest resistance level at 2.805.
Technical Reference: buy as long as the price stays above 2.766.00
Potential Take Profit 1: 2.797.00
Potential Take Profit 2: 2.805.00
Potential Stop Loss 1: 2.774.00
Potential Stop Loss 2: 2.7666.00








