

The price of Gold has shown a downward correction after reaching the upper boundary of the Bollinger Bands. This correction has pulled the price closer to the middle band on the Bollinger Bands indicator, which often acts as a dynamic support zone. This scenario indicates that the potential for a rebound toward an upward trend remains significantly viable.
The MACD technical indicator further reinforces the bullish potential, with the histogram consistently showing positive values, while the MACD line remains above the signal line. This indicates that bullish momentum continues to dominate the market.
Recommended

Recommended

Recommended

Recommended
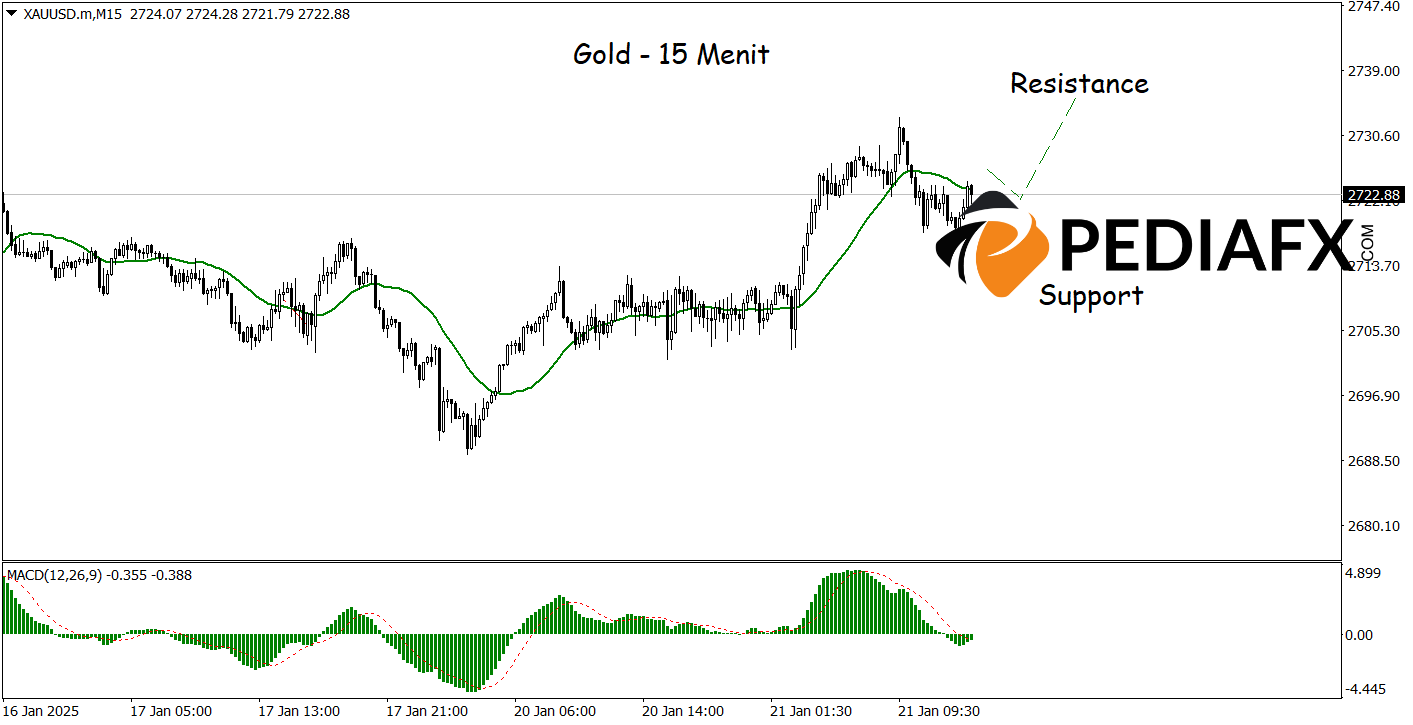
On the 15-minute chart above, Gold is beginning to show signs of an upward movement as the MA currently continues to stay below the running price, signaling an ongoing uptrend. The MACD indicator also displays a bullish condition, strengthening the increasing buying momentum. If this scenario unfolds as anticipated, the price of Gold could reach the resistance level at $2,735.
Technical Reference: buy as long as it stays above 2,710.00
Potential Take Profit 1: 2,730.00
Potential Take Profit 2: 2,735.00
Potential Stop Loss 1: 2,715.00
Potential Stop Loss 2: 2,710.00


