

The movement of Gold on the 1-hour time frame indicates a continuation potential of the upward trend after the price successfully formed a break high in a triangle pattern. This structure serves as an early signal that buying pressure remains dominant, opening up opportunities for price movements towards the nearest resistance level. Currently, the price also appears to be returning to a reasonable pullback area before resuming its upward trajectory, which suggests a healthy correction while still being within a bullish trend.
From a technical indicator standpoint, the ZigZag pattern demonstrates a series of higher highs and higher lows, confirming the uptrend structure. Meanwhile, the Moving Average shows a flattening trend that leans upward, reflecting maintained momentum. This situation is further reinforced by the CCI being in the oversold territory, thus creating space for a potential new buying surge. The combination of price patterns and these indicators provides a bullish bias for Gold in the short-term.
Recommended

Recommended

Recommended

Recommended
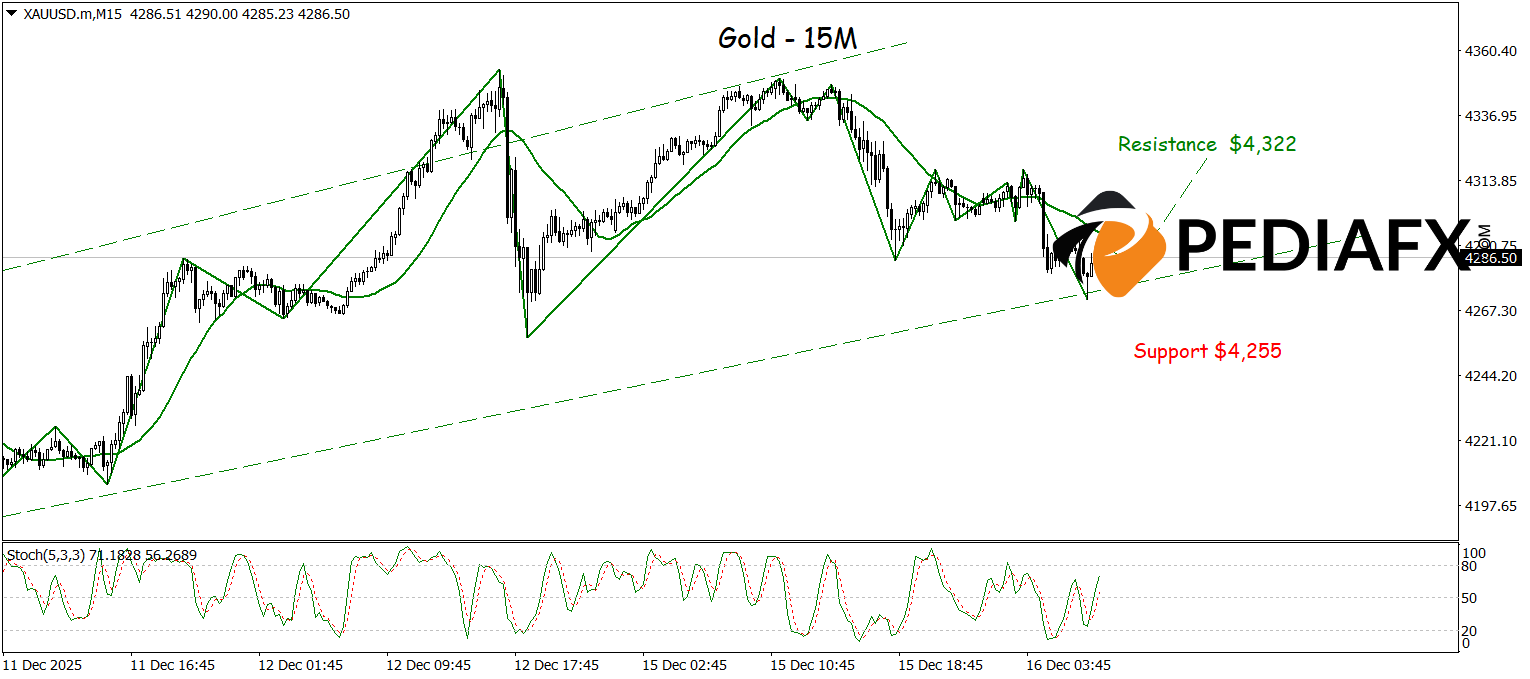
On the 15-minute chart, Gold is currently positioned within the lower area of a bullish channel, indicating that a rebound upwards is still likely. The price structure indicated by ZigZag shows a low level suggesting that the weakening is beginning to taper off, while the Stochastic indicator appears to be rebounding from a low point, reflecting a resurgence in buying interest. This combination of technical signals supports the potential for Gold to test the resistance level at $4,322 in the near term.
Technical Reference: buy while above 4,255
Potential Take Profit 1: 4,310
Potential Take Profit 2: 4,322
Potential Stop Loss 1: 4,367
Potential Stop Loss 2: 4,255


