

The recent breach of the bullish channel support area serves as a critical signal that the upward momentum of Nasdaq is fading. After displaying a steady upward pattern, the drop below the support line indicates that buyers are losing their grip, and the bullish structure is not as robust as it previously was. This price decline also reflects a shift in short-term market sentiment, moving from a predominantly bullish stance to one that is more cautious, with escalated selling pressure whenever prices attempt to rebound.
Technical indicators reinforce the likelihood of further bearish developments, evidenced by the moving average (MA) trending downward and the MACD positioned in negative territory, signaling a decrease in buying momentum and an uptick in seller strength. This combination of indicators presents the Nasdaq with an opportunity to continue its decline, testing nearby low levels on the hourly chart. Should selling pressure remain steady and the price fail to recover back into the bullish channel, the bearish trend in the short term could expand over the coming sessions.
Recommended

Recommended

Recommended

Recommended
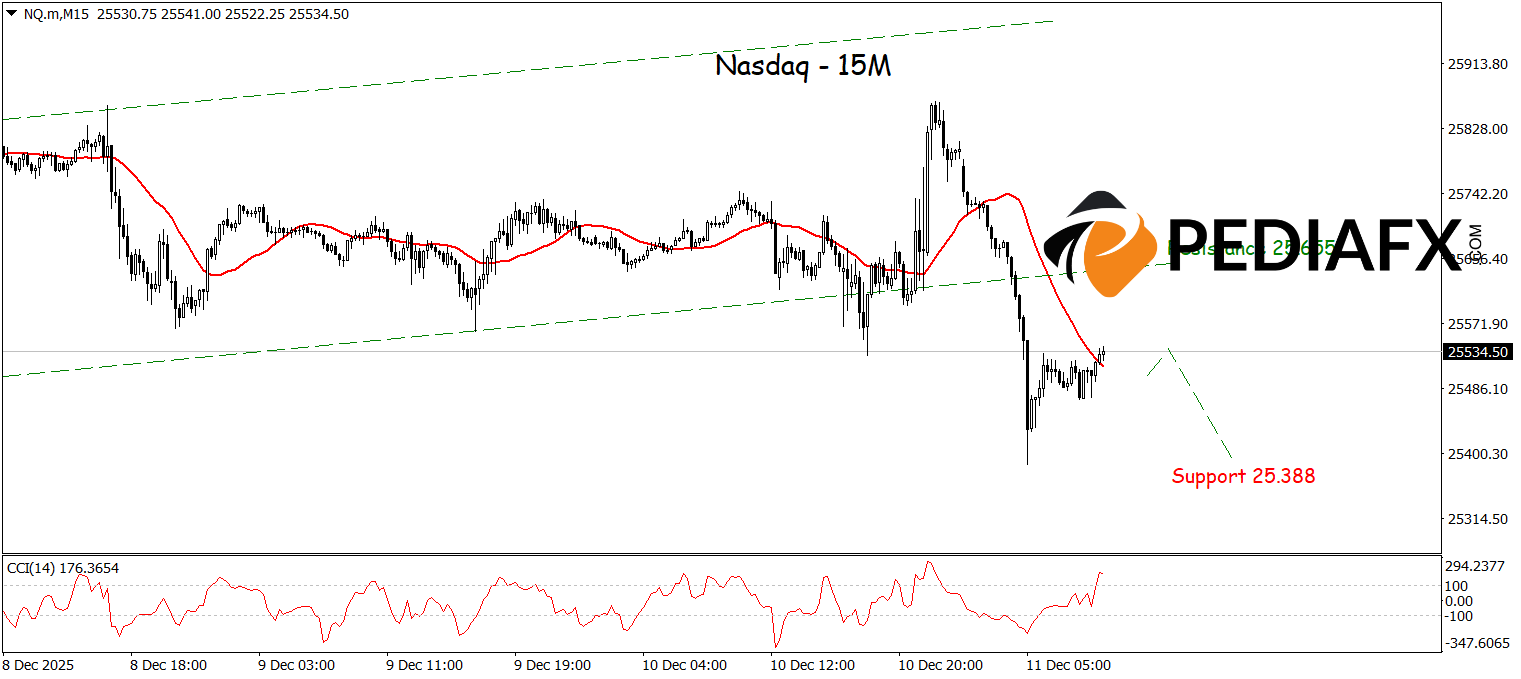
The breach of the bullish channel indicates a weakening structure for Nasdaq’s rise, while the declining MA and the CCI in overbought territory further increase the pressure for potential price decline. This confluence of technical indicators suggests that buyers are starting to lose their momentum, with seller dominance returning to the intraday movements. Given these conditions, Nasdaq may continue to fall to test the support level of 25,388, as long as it remains unable to break back into the previously breached bullish channel.
Technical Reference: sell while below 25,655
Potential Stop Loss 1: 25,605
Potential Stop Loss 2: 25.655
Potential Take Profit 1: 25,440
Potential Take Profit 2: 25,388


