

Currently, the USDJPY on the 1-hour timeframe is moving within a bearish channel, indicating that selling pressure is still predominant within the price movement structure. This pattern is further reinforced by the zigzag direction, which continues to show a downward trend, even if small upward patterns are occasionally formed as part of a technical correction. As long as the price remains within the boundaries of this channel, the bearish bias will remain the primary controlling factor in the market.
Additional signals come from the CCI indicator, which is now in an overbought condition, reflecting that the short-term upward momentum is beginning to lose steam. This overbought condition often triggers the market to experience a decline, aligning with the existing bearish channel structure. With this combination of technical pressures, USDJPY is likely to continue its decline in the short term unless there is a significant breakthrough that pushes the price outside the current bearish pattern.
Recommended

Recommended

Recommended

Recommended
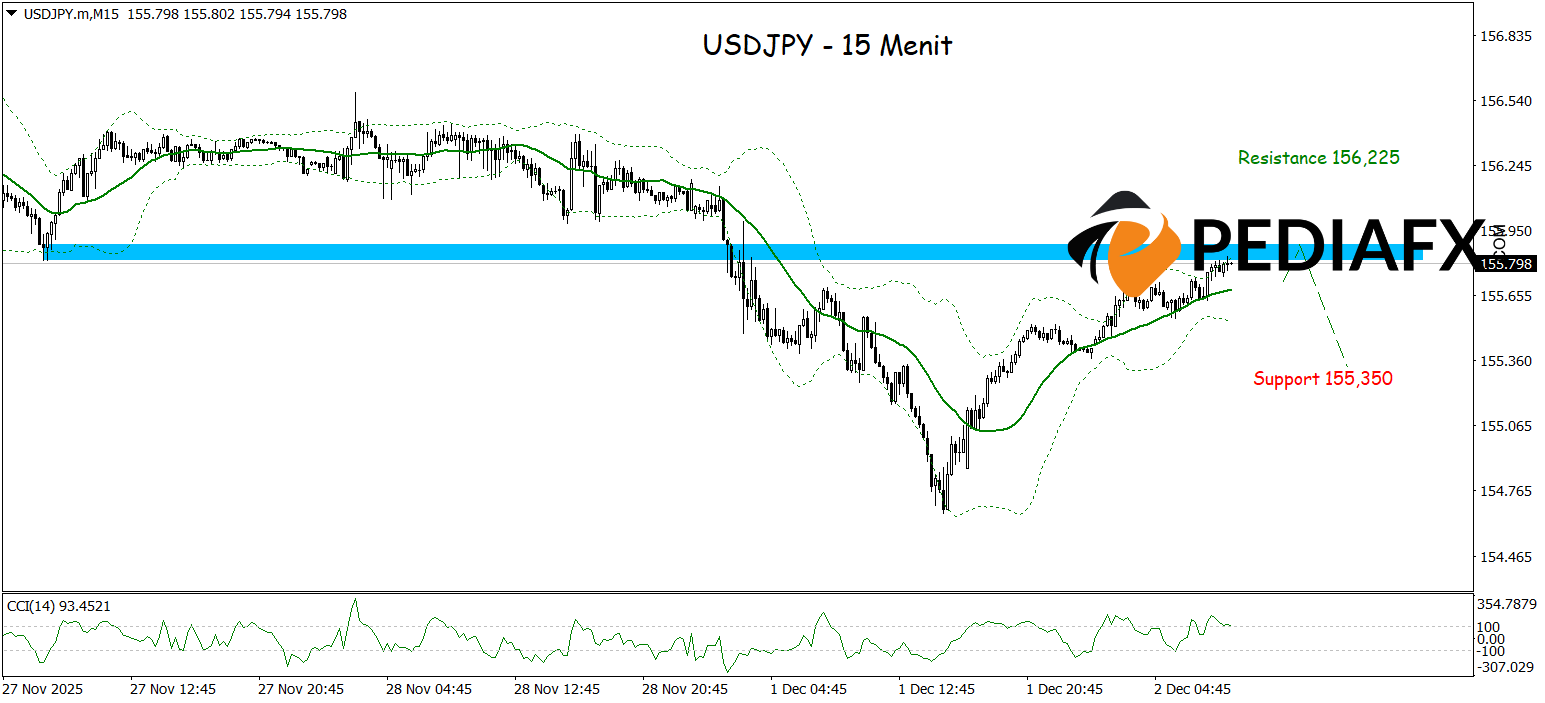
The current price is situated at the resistance level of the Bollinger Bands (BB), while the CCI indicator has entered an overbought state, signaling that the potential for a decline is increasing. Furthermore, the price has returned to the SBR area (Support Become Resistance), which was previously a strong support level on the 15-minute chart before it was breached, reinforcing the notion that this pullback could mark the beginning of a continuation of the bearish trend. If selling pressure dominates from this zone, USDJPY could extend its decline and test the nearest support level at 155,350.
Technical Reference: Sell while below 156,225
Potential Take Profit 1: 156,105
Potential Take Profit 2: 156,225
Potential Stop Loss 1: 155,480
Potential Stop Loss 2: 155,350


