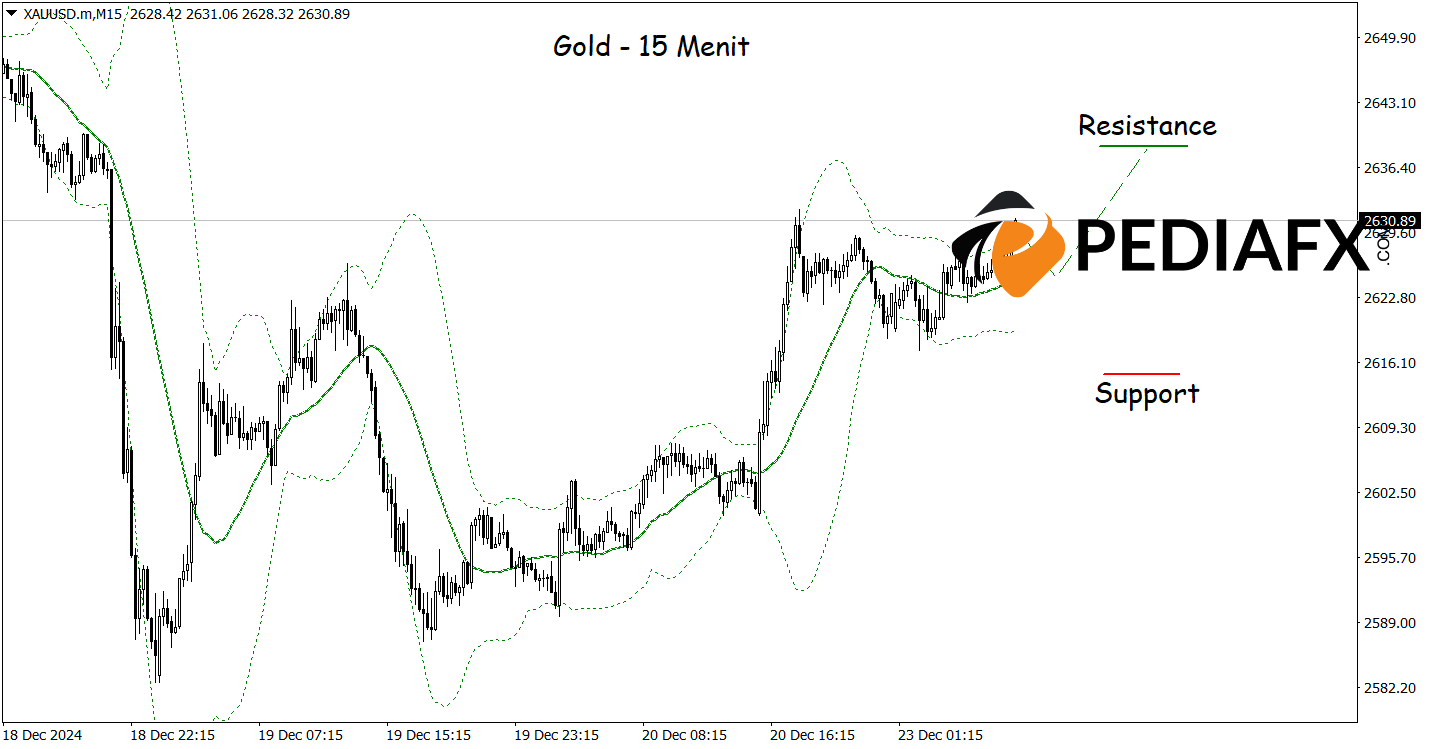
Gold is exhibiting significant signs of recovery after successfully breaking through a bearish channel. In recent trading sessions, Gold prices have surpassed previous constraints that limited its ascent, signaling strong bullish potential.
Technical analysis reveals that the Moving Average (MA) has provided positive signals, with the short-term MA line crossing above the long-term MA line. This is often interpreted as a bullish indicator suggesting that an upward trend may continue. Furthermore, the MACD (Moving Average Convergence Divergence) indicator also reflects strengthening momentum, with the MACD line moving above the signal line, increasing confidence that Gold prices will continue to rise.

On the 15-minute chart above, Gold still shows bullish potential as the upward-directed Bollinger Bands may support Gold’s price. If the scenario unfolds as expected, Gold could rise towards the resistance level of $2,638.00 per troy ounce.
Technical References: Buy as long as above 2,638.00
Potential Take Profit 1: 2,634.00
Potential Take Profit 2: 2,638.00
Potential Stop Loss 1: 2,619.00
Potential Stop Loss 2: 2,614.00


