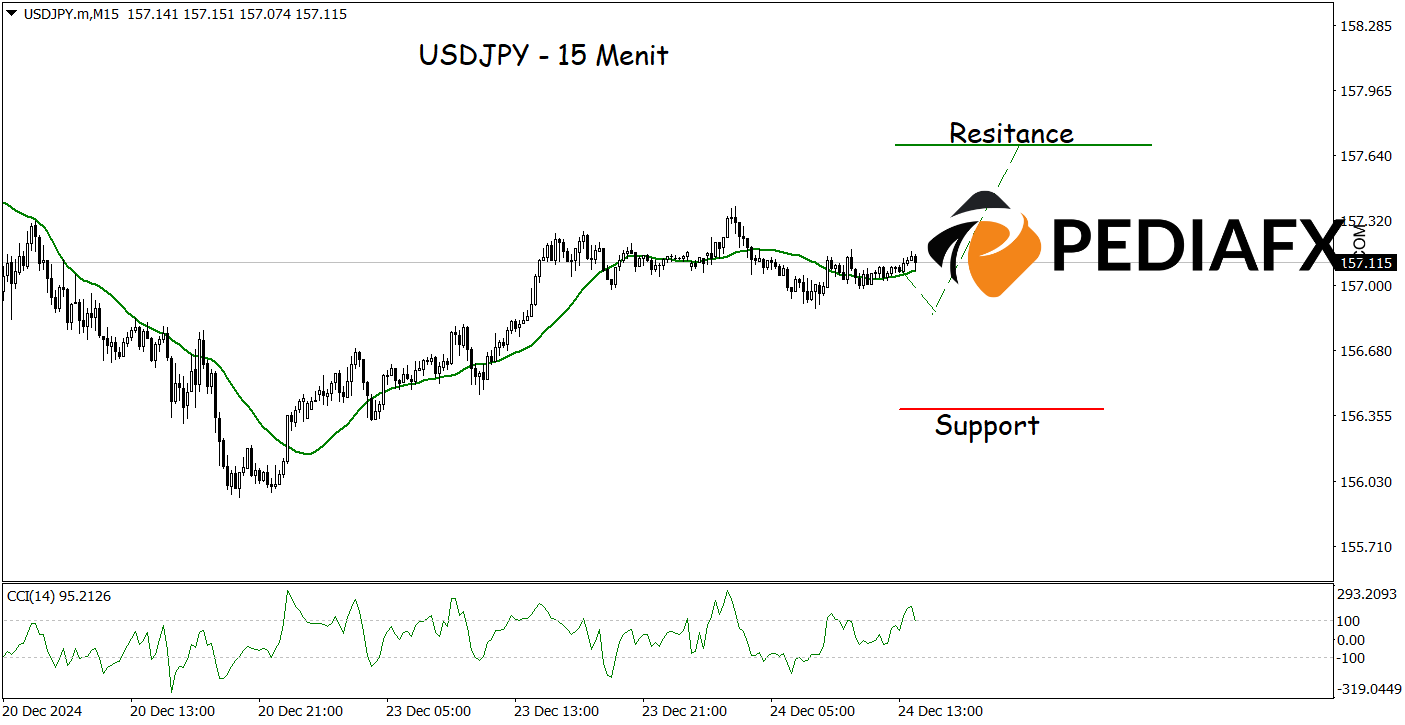
The currency pair USDJPY is exhibiting strong upward potential as its price remains well within a bullish channel. This bullish trajectory is further bolstered by key technical indicators, specifically the Moving Average (MA) and the Moving Average Convergence Divergence (MACD), both of which are signaling positivity in the market.
The MA indicator shows that the price is trading above its moving average line, indicating that the bullish momentum continues to dominate. Furthermore, the MACD affirms this positive trend with its MACD line positioned above the signal line, along with a histogram that remains in the positive territory.

Additionally, a similar analysis can be observed on the 1-hour chart. The 15-minute chart displayed here also suggests an upward opportunity as the MA is trending upward and the CCI has successfully rebounded from the oversold area, enhancing the potential for USDJPY’s rise. If this scenario unfolds, USDJPY might test the resistance level at 157.680.
Technical Reference: buy as long as it remains above 156.365
Potential Take Profit 1: 157.460
Potential Take Profit 2: 157.680
Potential Stop Loss 1: 156.660
Potential Stop Loss 2: 156.365


