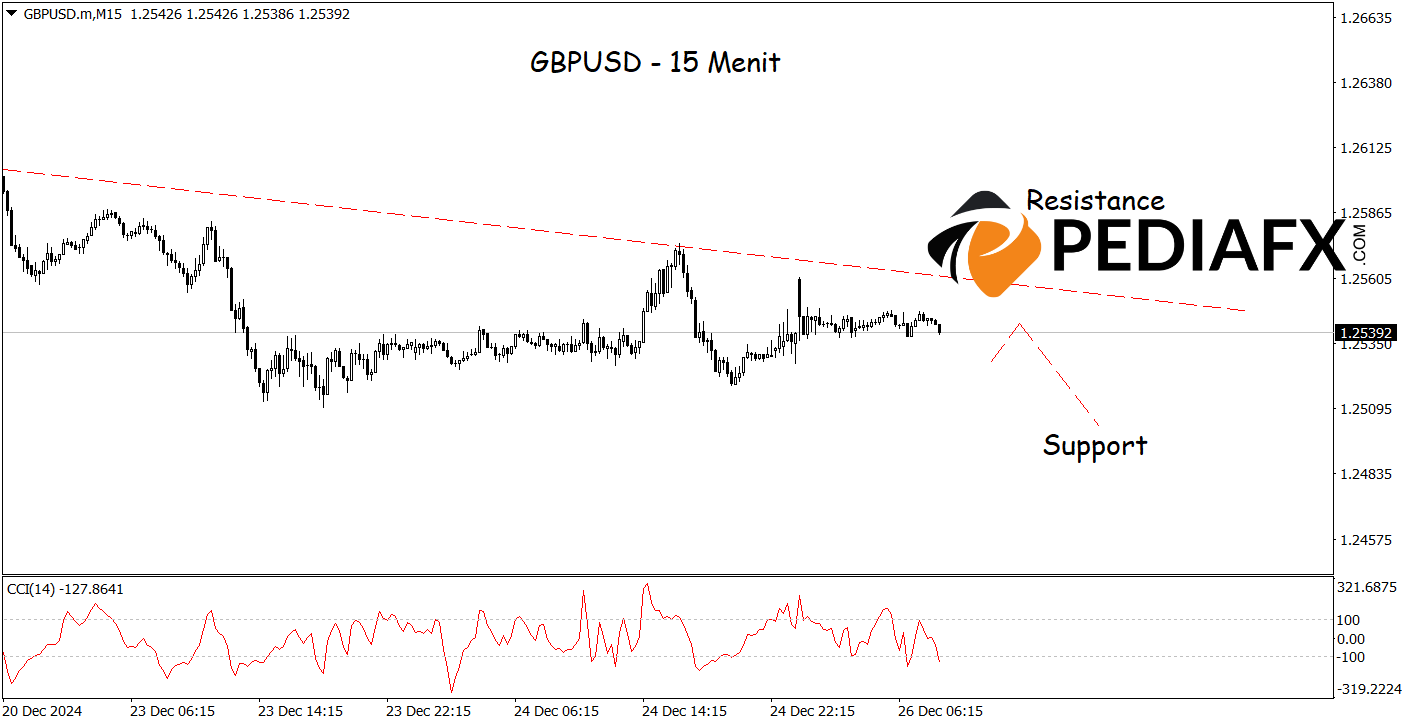
The GBPUSD currency pair is experiencing considerable selling pressure following a 突破 from a crucial 支援 level, indicating a possible further decline. The 24-period Moving Average (MA) reinforces bearish indications, as it continues to point downwards. This trend illustrates the prevailing selling dominance in the short term.
Furthermore, the MACD indicator adds to the bearish confirmation, with the signal line positioned below the zero line and the histogram displaying negative momentum. The recent 突破 has been succeeded by a 拉回 朝向 反抗 zone, which presents an opportunity for market participants to initiate sell positions.

Aligning with the hour chart analysis provided above, on the 15-minute chart, GBPUSD also showcases bearish potential as the Stochastic CCI indicator is in a strong bearish condition, signifying a downward momentum. There is a likelihood that GBPUSD could continue to drop towards the 支援 level of 1.24830.
Technical Reference: Sell while below 1.25860
Potential Stop Loss 1: 1.25700
Potential Stop Loss 2: 1.25860
Potential Take Profit 1: 1.25020
Potential Take Profit 2: 1.24830


