According to the recent technical analysis conducted in Europe, GBPUSD has been on a downward trajectory, indicating sustained signs of decline after breaking below the previously supportive bullish channel. This break below suggests the potential initiation of a reversal that could drive prices down further.
The technical indicators reveal that following the breach of the lower boundary of the bullish channel, GBPUSD has experienced a pullback, signaling that the previous bullish momentum has started to wane. Furthermore, the Stochastic indicator is currently providing bearish signals, reinforcing the likelihood of a continued decline. When the Stochastic indicator enters the overbought territory and begins to trend downwards, it is often a precursor to impending price corrections.

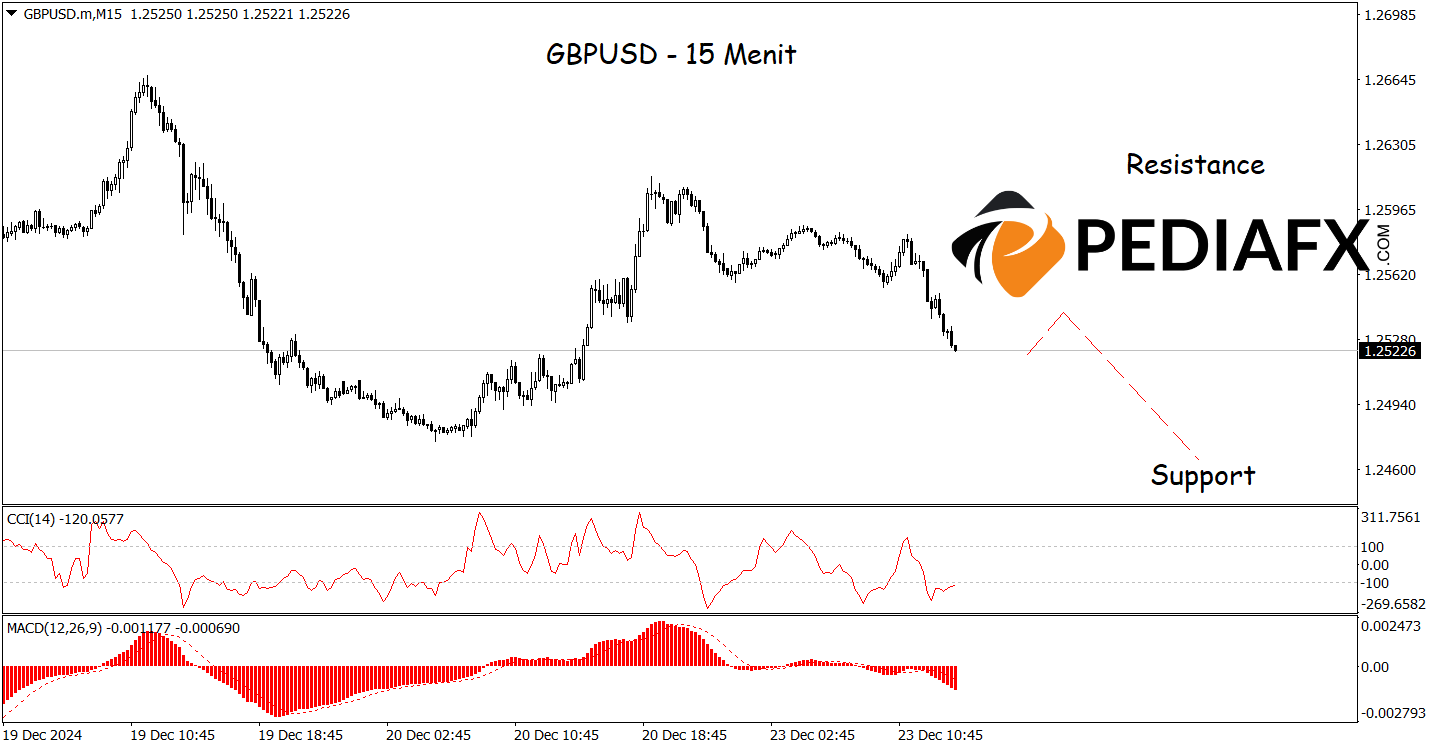
Consistent with the one-hour chart analysis mentioned above, within the 15-minute timeframe, GBPUSD also offers bearish opportunities, as the CCI Stochastic indicator indicates a strong bearish condition, highlighting that the decline may continue. There is a potential for GBPUSD to drop to the support level at 1.24640.
Technical Reference: sell below 1.26130
Potential Stop Loss 1: 1.25860
Potential Stop Loss 2: 1.26130
Potential Take Profit 1: 1.24860
Potential Take Profit 2: 1.24640


