The GBPUSD currency pair is showing signs of a potential decline following its break below the previously supportive bullish channel. This break below signals the possibility of an initial trend reversal that could lead to a decrease in price.
Technical analysis reveals that after piercing the lower boundary of the bullish channel, GBPUSD is experiencing a pullback which suggests that the bullish momentum has weakened. Additionally, the Stochastic indicator is emitting bearish signals, bolstering the forecast of a downward trend. When the Stochastic is in the overbought zone and starts to decline, it often indicates that the price is poised for a correction.

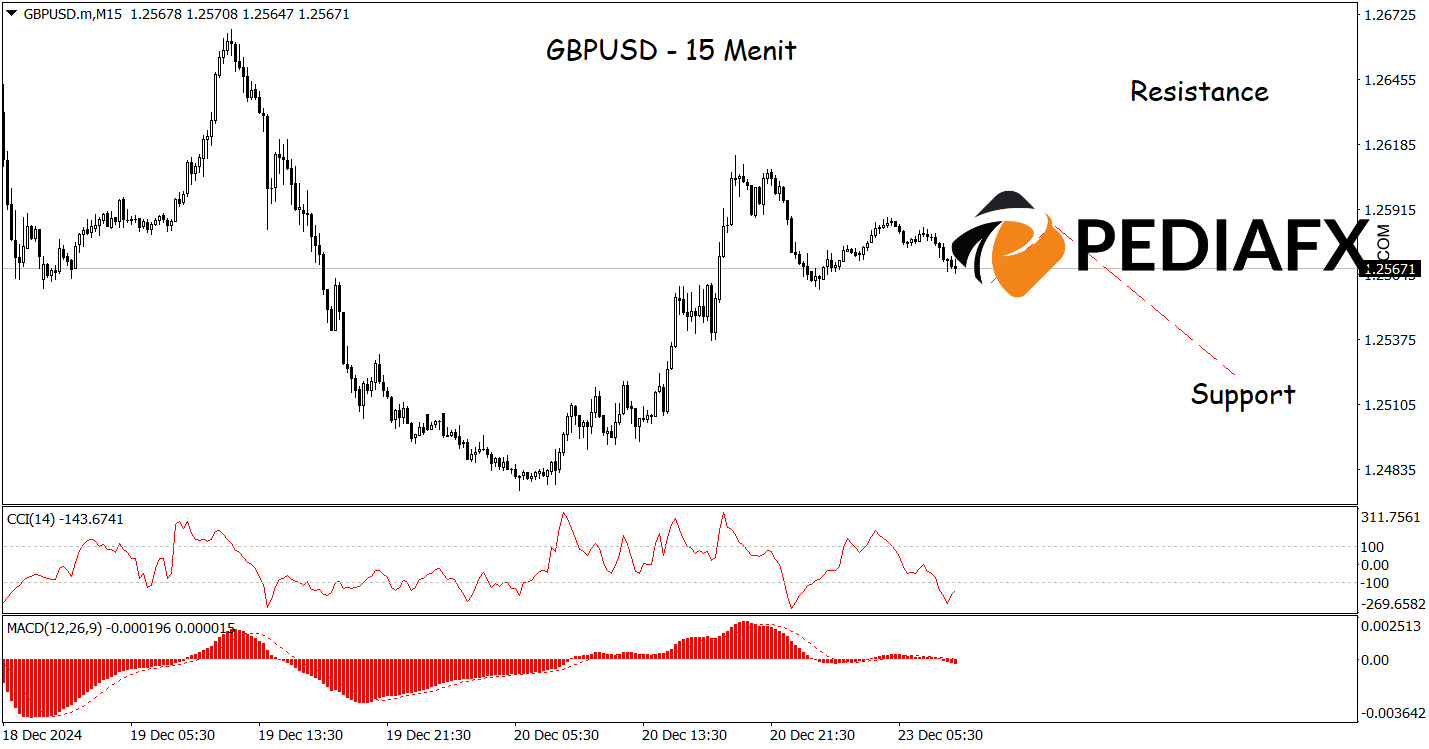
In line with the hour chart movement analysis above, the 15-minute chart also presents a bearish opportunity, as the CCI Stochastic indicator remains in a Strong Bearish condition, indicating a downward momentum. GBPUSD is likely to move down to the support level of 1.25200.
Technical Reference: sell while below 1.26370
Potential Stop Loss 1: 1.26185
Potential Stop Loss 2: 1.26370
Potential Take Profit 1: 1.25375
Potential Take Profit 2: 1.25200


