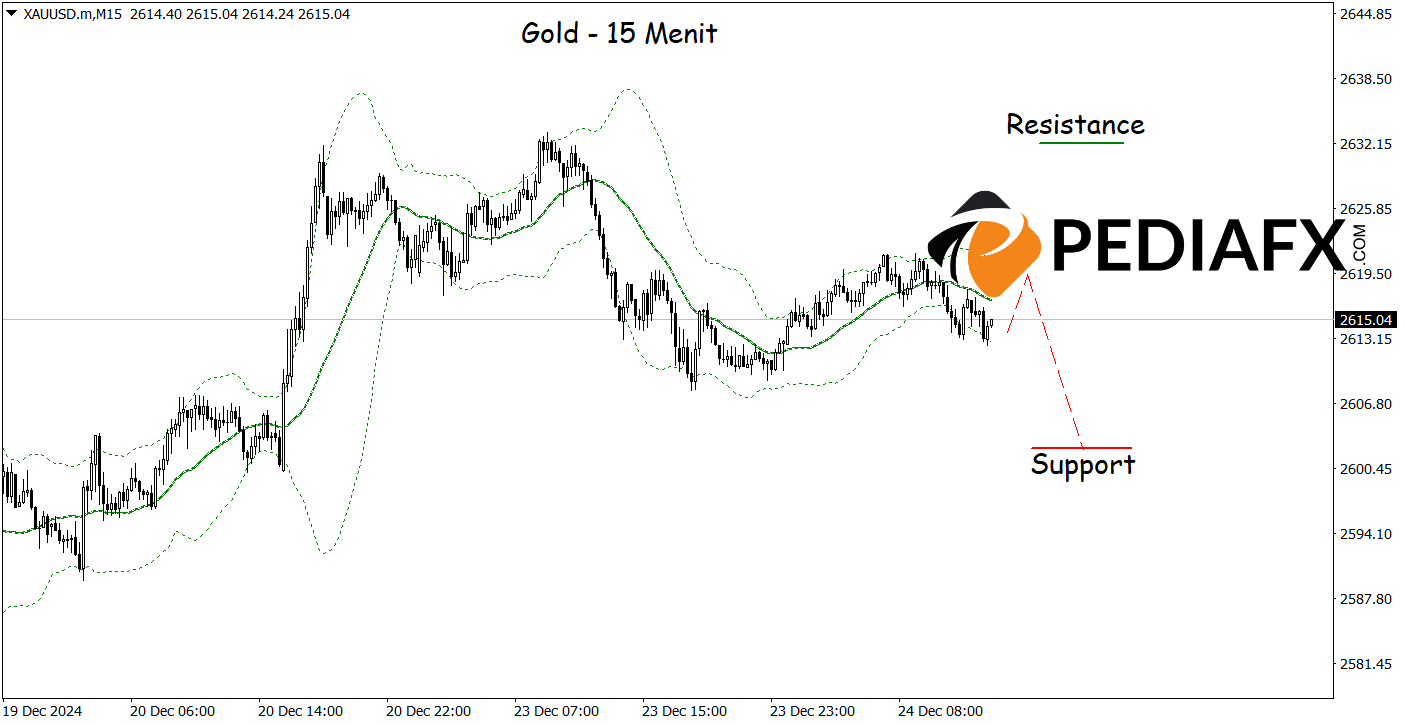
Currently, Gold prices are experiencing significant selling pressure as key technical indicators—Moving Average (MA) and MACD (Moving Average Convergence Divergence)—reveal distinct bearish signals.
The MA indicates that Gold prices are trading below the short-term moving average line, which often serves as a robust sign of an ongoing downward trend. Meanwhile, the MACD reinforces the bearish sentiment, with the MACD line positioned beneath the signal line and the histogram residing in negative territory.

On the 15-minute chart, Gold displays bearish signals as the price has struggled to break through the upper boundary of the Bollinger Bands, highlighting that selling opportunities may still be present. If this scenario unfolds as anticipated, Gold prices could move towards the support level at 2,602.00.
技术参考: 卖 while below 2,632.00
Potential Stop Loss 1: 2,628.00
Potential Stop Loss 2: 2,632.00
Potential Take Profit 1: 2,606.00
Potential Take Profit 2: 2,602.00


