In the 1-hour chart, the Nasdaq remains below the 20-period Moving Average (MA) and the 50-period MA, which have previously crossed. Additionally, the Stochastic indicator is trending upward and is approaching a significant resistance level around 21,380.
This suggests that if the Stochastic continues to rise and approaches this resistance, it will enter the overbought territory. This scenario could signal a potential decline.
ที่แนะนำ
ที่แนะนำ
ที่แนะนำ
ที่แนะนำ

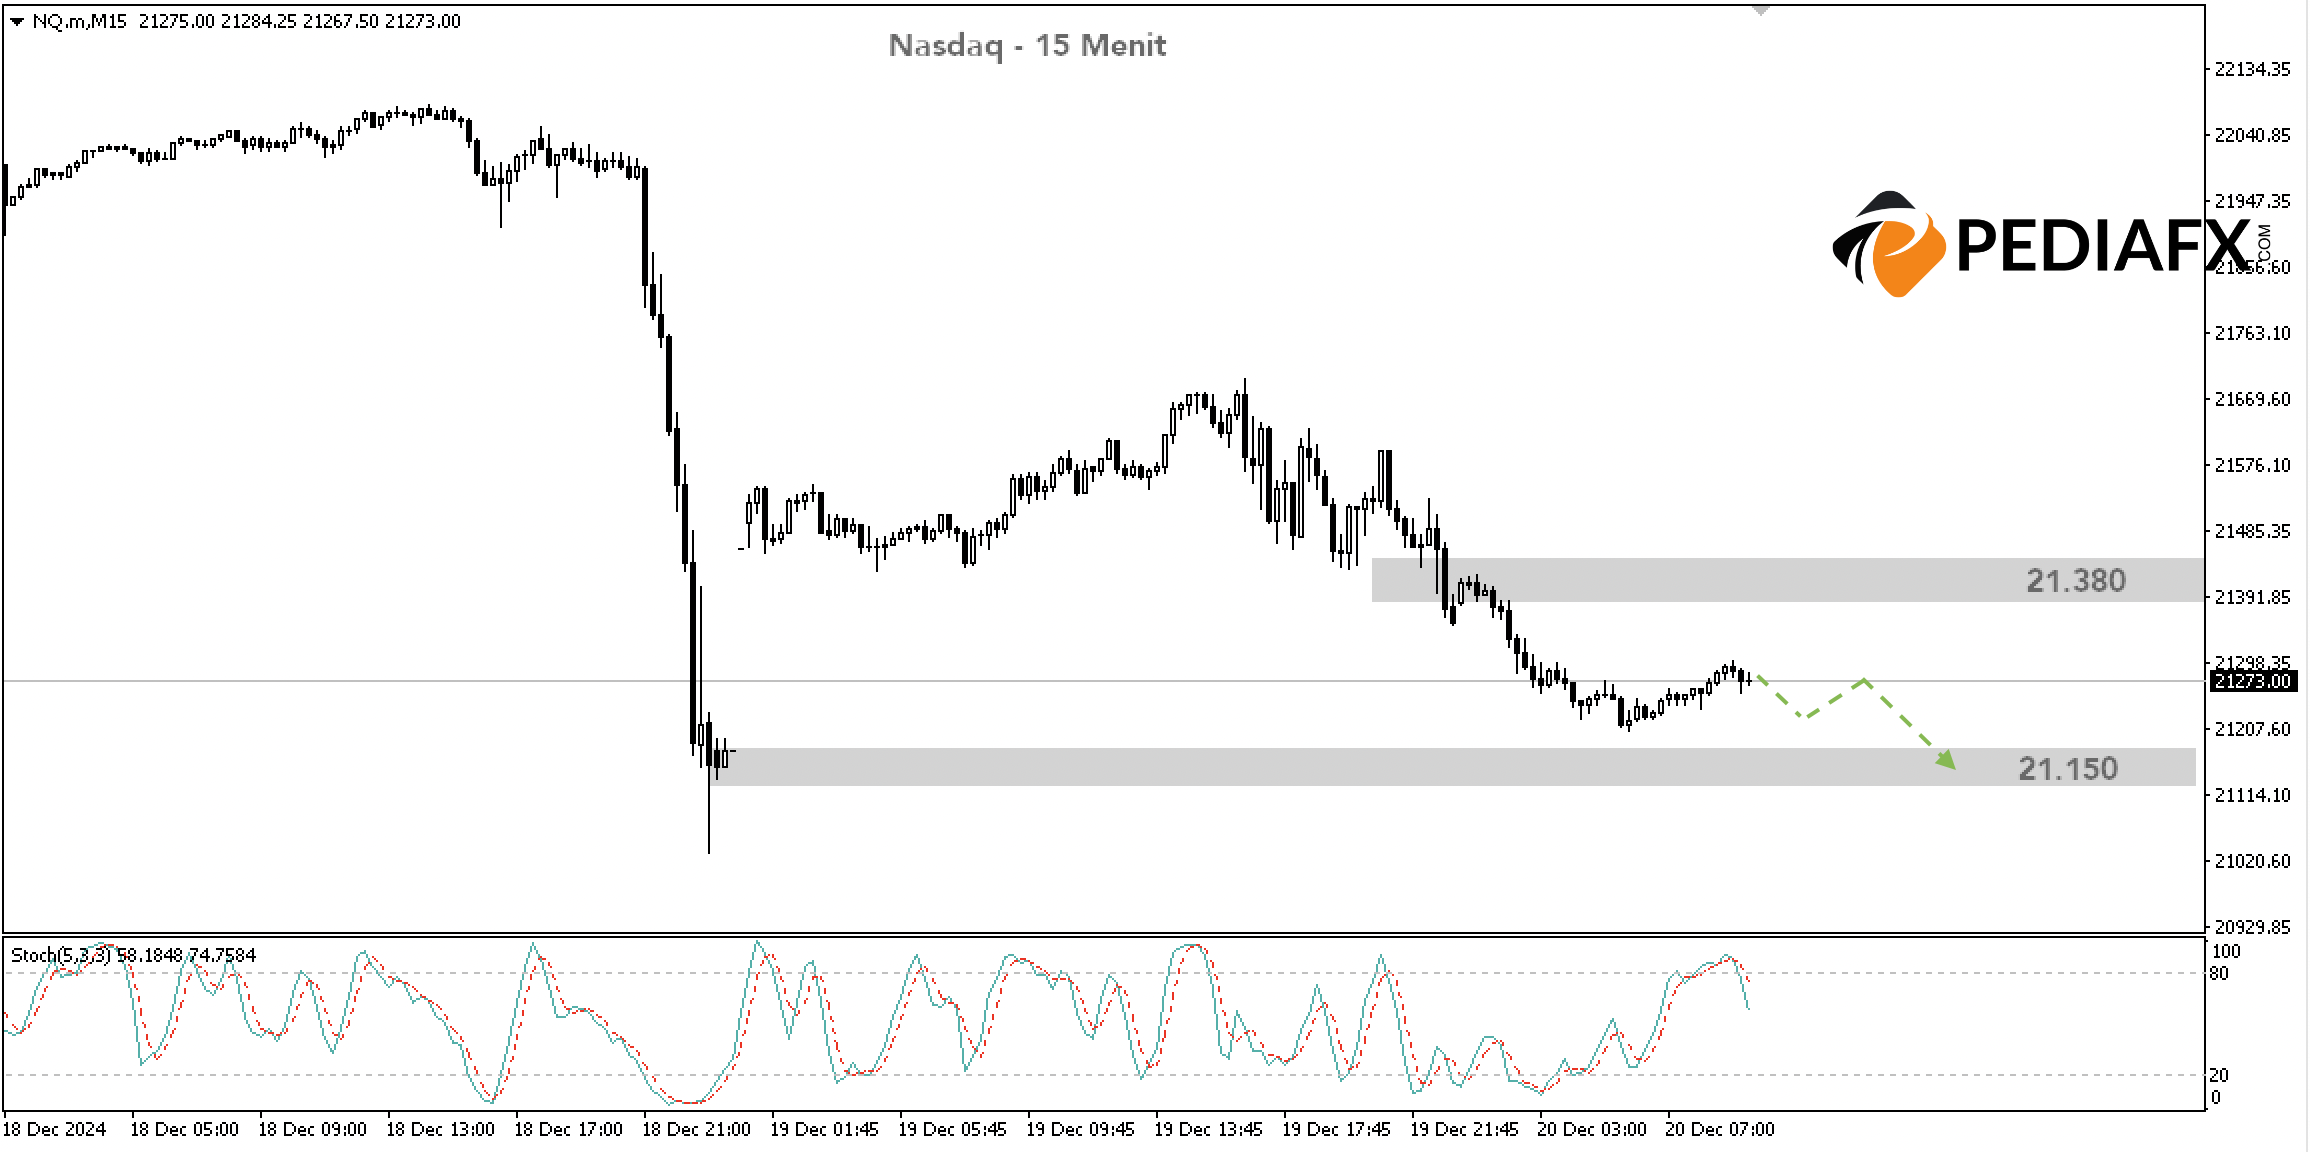
On the 15-minute chart, the Stochastic has already reached the overbought zone, increasing the potential for a decline. As long as it remains below 21,380, there is a possibility that Nasdaq could drop to 21,150.
Technical reference: sell below 21,380
Potential Take Profit 1: 21,150
Potential Take Profit 2: 21,000
Potential Stop Loss 1: 21,380
Potential Stop Loss 2: 21,500


